Generate homology groups based on similarity of protein sequences. The
resulting homology groups connect similar sequences in the pangenome
database. Homology groups contain not only orthologous pairs, but also
pairs of homologs duplicated after the speciation of the two species,
so-called in-paralogs. The sizes of the groups are controlled by the
--relaxation parameter that can be set very strict or more lenient,
depending on the evolutionary distance of the genomes. When you are
unsure which relaxation setting is most suitable for your dataset,
running the optimal_grouping
functionality is recommended.
Be aware that not every sequence within a homology group has to be
similar to the other sequences. For example, two non-similar protein
sequences each have a high-similarity hit with the same protein sequence
but align to a different region, one at the start and one near the end
of the sequence.
When you want to run group another time but with different
parameters, the currently active grouping must first either be moved or
removed. This can be achieved with the
remove or
deactivate grouping
functions.
Method
Here, we explain a simplified version of the original algorithm,
please take a look at our publication for an extensive explanation.
First, potential similar sequences are identified by counting shared
k-mer (protein) sequences. Similarity between the selected protein
sequences is calculated through (local) Smith-Waterman alignments.
When the (normalized) similarity score of two sequences is above a
given threshold (controlled by --relaxation), the proteins are
connected with each other in the similarity graph. Every similarity
component is then passed to the MCL (Markov clustering) algorithm to
be possibly broken into several homology groups. MCL can create
overlapping groups if two proteins within a component have identical
similarity scores, in this case the overlapping groups are merged and
labelled as a “merged” group.
Relaxation
The relaxation parameter is a combination of four sub-parameters:
intersectionrate, similaritythreshold, mclinflation
and contrast. The values for these parameters for each relaxation
setting can be seen in the table below. We strongly recommend using the
--relaxation option to control the grouping, but advanced users still
have the option to control the individual sub-parameters.
Number of parallel working threads, default is the number of
available cores or 8, whichever is lower.
--include/-i
Only include a selection of genomes.
--exclude/-e
Exclude a selection of genomes.
--annotations-file/-A
A text file with the identifiers of annotations to be included,
each on a separate line. The most recent annotation is selected
for genomes without an identifier.
--longest
Only cluster protein sequences of the longest transcript per gene.
--scoring-matrix
The scoring matrix used, default is BLOSUM62.
--relaxation
The relaxation in homology calls. Should be in range [1-8], from
strict to relaxed. This argument automatically sets
the four remaining arguments stated below.
--intersection-rate
The fraction of k-mers that needs to be shared by two intersecting
proteins. Should be in range [0.001,0.1].
--similarity-threshold
The minimum normalized similarity score of two proteins. Should be in
range [1..99].
pantools_homology_groups.txt, overview of the created homology
groups. Each line represents one homology group, starting with the
homology group (database) identifier followed by a colon (:) and mRNA
identifiers (from GFF) that are separated by a space. To ensure all
identifiers are unique in this file, the mRNA ids are extended by a
hash symbol (#) and a genome number. The following line is example
output of an homology group with two genes from genome 1 and 146:
BUSCO is used in PanTools to estimate the optimal settings for
grouping relaxation, in conjunction with the
optimal_grouping function.
BUSCO attempts to provide a quantitative assessment of the completeness
in terms of expected gene content of a genome assembly. Proteins are
placed into categories of Complete and single-copy (S), Complete and
duplicated (D), fragmented (F), or missing (M). This
function is able to run BUSCO v3, v4 or v5 against protein
sequences of the pangenome.
The number of reported duplicated genes in eukaryotes is often to high
as different protein isoforms are counted multiple times. To adjust the
imprecise duplication score, include the --longest-transcripts
argument to the command.
What BUSCO benchmark set to use
When using BUSCO v3, go to https://busco.ezlab.org, download a odb9
set, and untar it with tarxvzf. Include the entire directory in
the command using the --input-file argument.
For BUSCO v4 or v5, you only have to provide the odb10 database
name with the --input-file argument, the database is downloaded
automatically. To get a full list of the available datasets, run
busco--list-datasets.
Required software
BUSCO must be set to your $PATH. For v3, test if the
whichrun_BUSCO.py command displays the full path so it can accessed
anywhere. For v4 and v5, test if busco is executable.
Parameters
<databaseDirectory>
Path to the database root directory.
Options
--threads/-t
Number of parallel working threads, default is the number of
available cores or 8, whichever is lower.
--include/-i
Only include a selection of genomes.
--exclude/-e
Exclude a selection of genomes.
--annotations-file/-A
A text file with the identifiers of annotations to be included,
each on a separate line. The most recent annotation is selected
for genomes without an identifier.
--busco-version/-v
The BUSCO version. Select either 4 or 5 (default).
(default).
--odb10
An odb10 benchmark dataset name.
--longest
Only search against the longest protein-coding transcript of
genes.
skip-busco
A list of questionable BUSCOs. The completeness score is
recalculated by skipping these genes.
Finding the most suitable settings for group
can be difficult and is always dependent on evolutionary distance of the
genomes in the pangenome. This functionality runs group on all eight
--relaxation settings, from strictest (d1) to the most relaxed (d8).
To find the optimal setting, complete and non-duplicated BUSCO genes
that are present in all genomes are used to validate each setting.
Method
A perfect clustering of the sequences would place each BUSCO in a
separate homology group with one representative protein per genome.
When BUSCO is run against the pangenome, the proteins corresponding to
the BUSCO HMMs have been identified. For each BUSCO, the
representative proteins are checked whether these are clustered into a
single or multiple groups. These groups are searched to identify
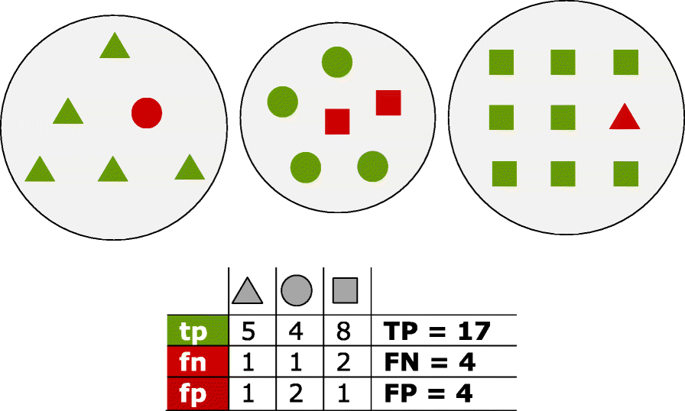
sequences other than the current BUSCO. The highest number of
correctly clustered BUSCOs present in one group are true positives
(tp). Any other gene clustered inside this group is considered a
false positive (fp) The remaining BUSCO genes outside this best
group are counted as false negative (fn). The summation of tps fps
and fns are defined as TP, FP and FN, respectively. From
these scores recall, precision and F-score measures are calculated as
follows:
Fig. 11 Proteins of three distinct homology groups are represented as
triangles, circles and squares. Green shapes are true positives (tp)
which have been assigned to the true group; red shapes are false
positives (fp) for the group they have been incorrectly assigned to, and
false negatives (fn) for their true group
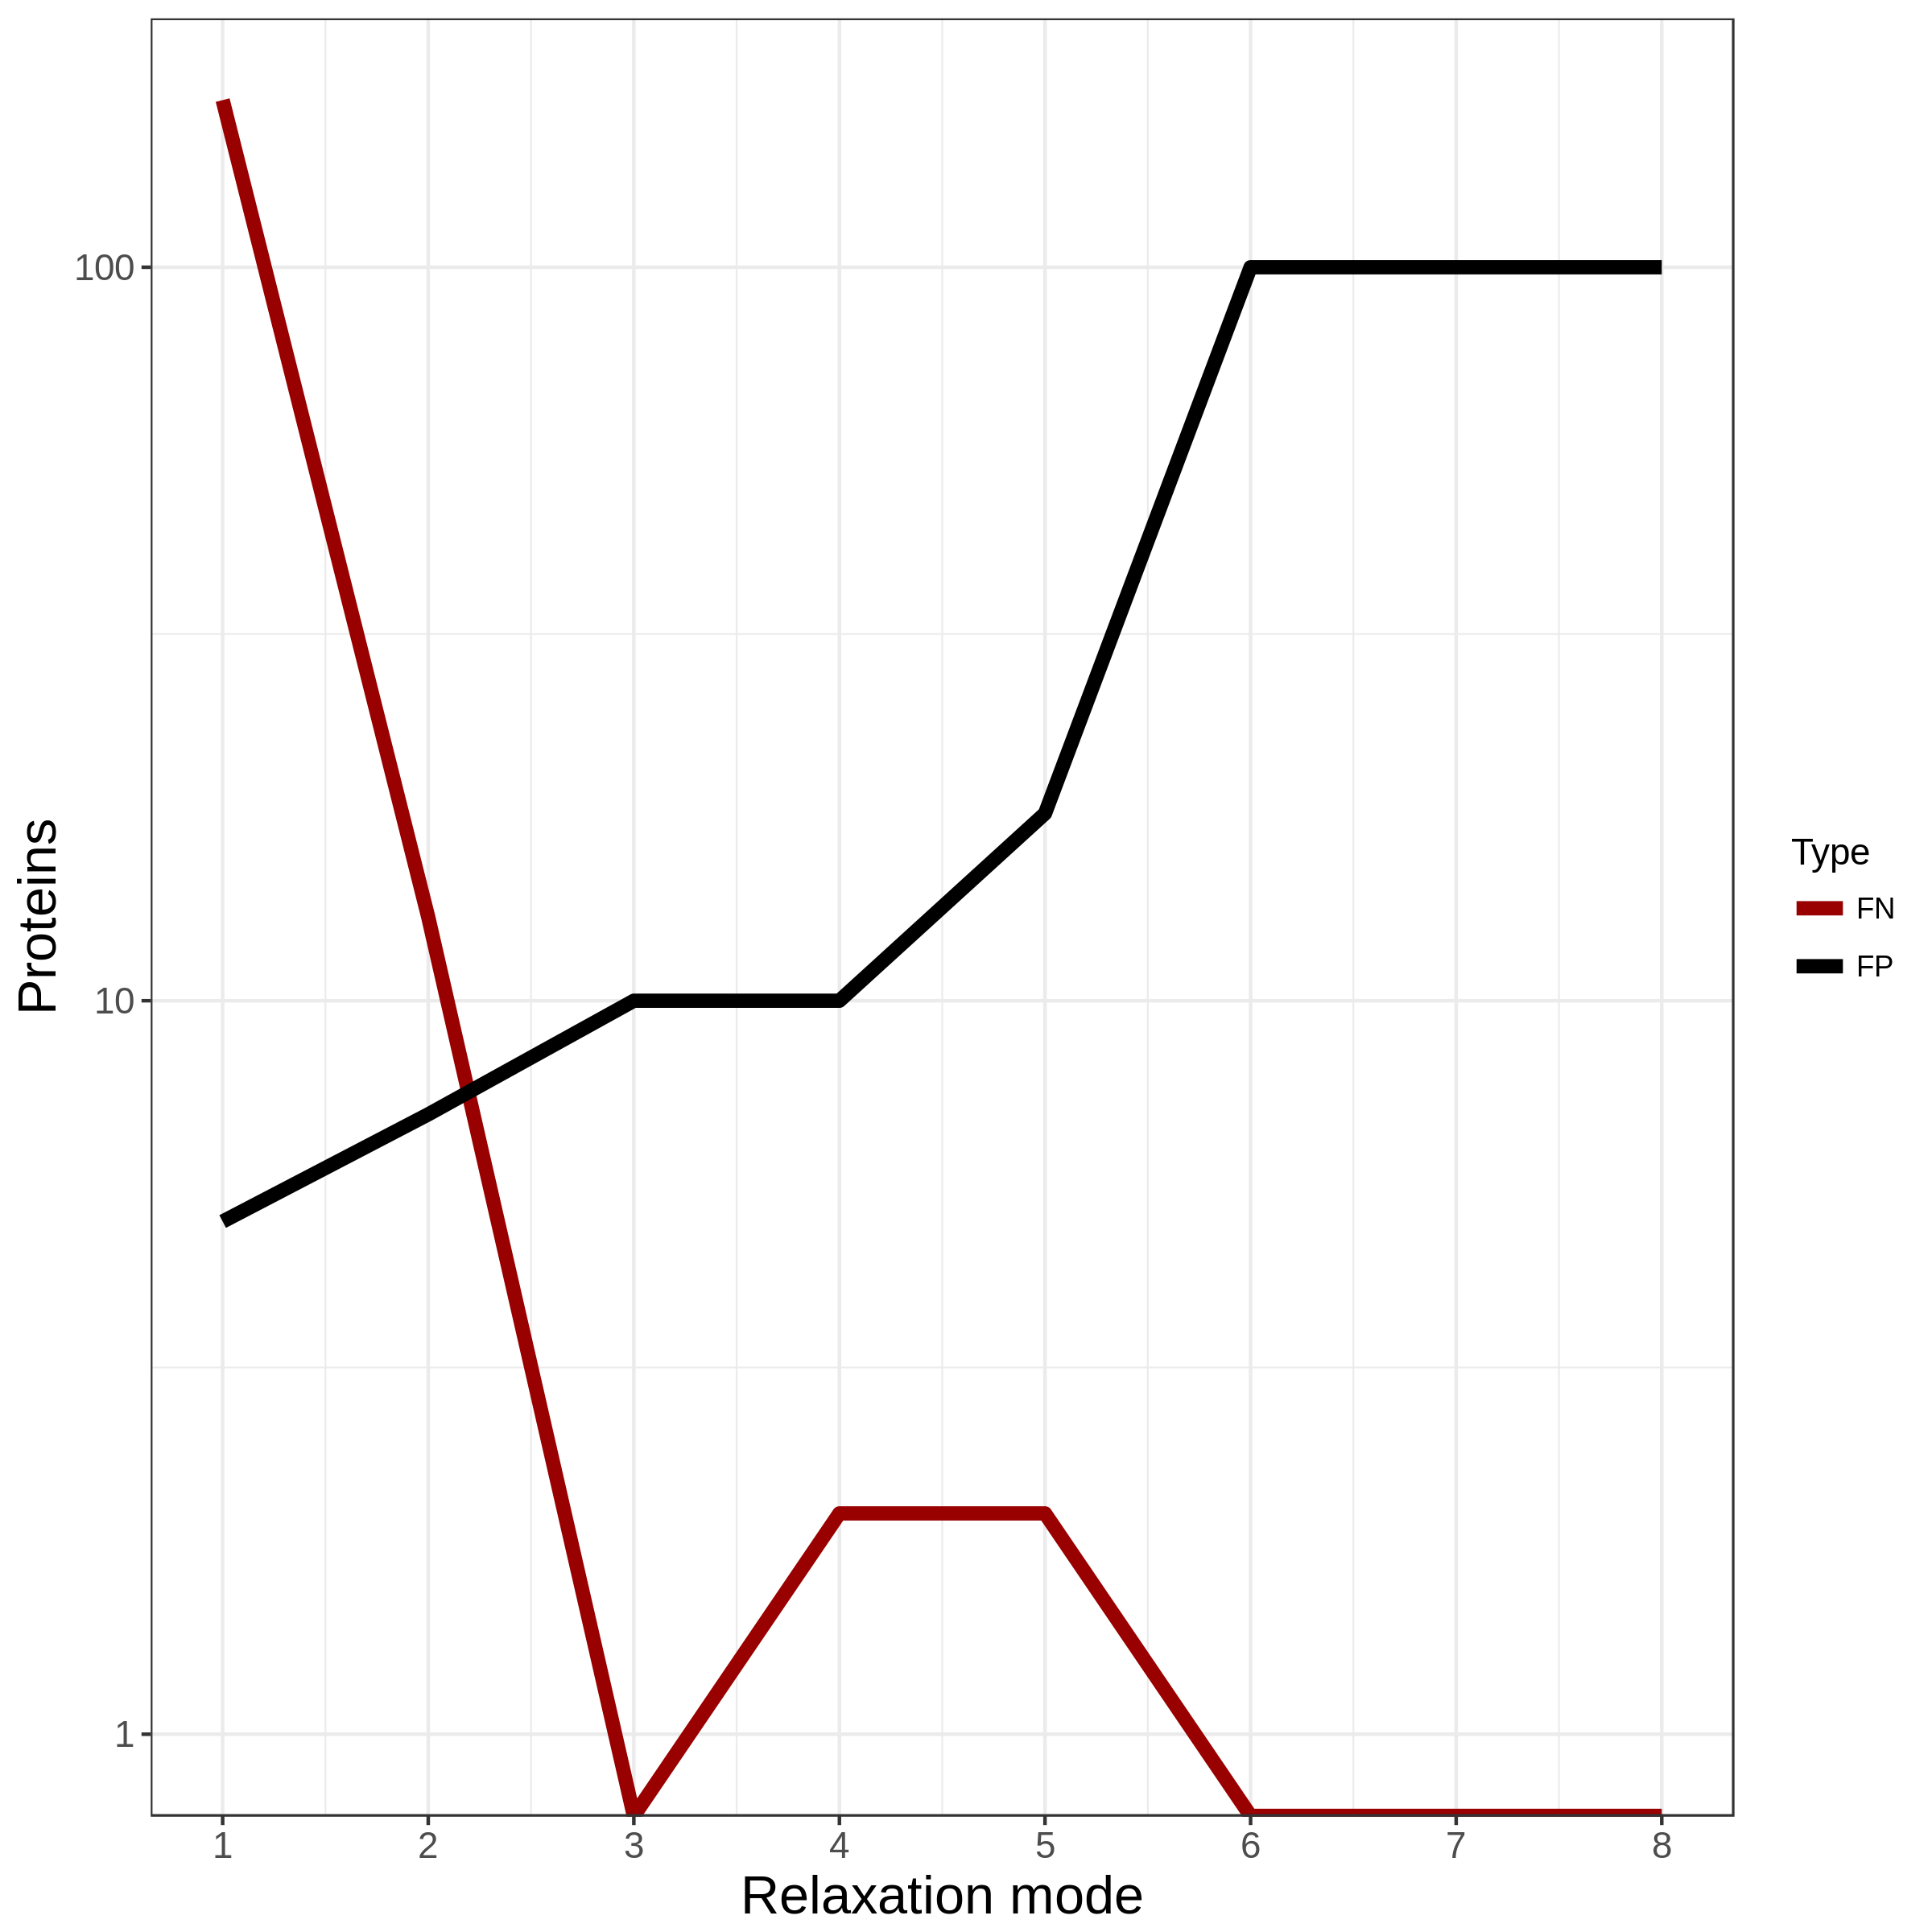
Choosing the optimal setting
Choosing the correct setting is usually a trade-off between TPs and
FNs. The most strict grouping results in a significantly higher number
of clusters as the more relaxed settings. With stringent settings,
related proteins could get separated; however, a high number of false
positives is (usually) prevented (FN > FP). When you would go for a
more loose setting, the related proteins are likely to part of the
same group, but other sequences could be included as well (FN < FP).
Note on active grouping
No grouping is active after running this function. Use the generated
output files to identify a suitable grouping. Activate this grouping
using change_grouping. An
overview of the available groupings and used settings is stored in the
‘pangenome’ node (inside the database), or can be created by running
grouping_overview.
The output directory created by the
busco_protein function.
This directory is found inside the pangenome database, in the
busco directory.
Options
--threads/-t
Number of parallel working threads, default is the number of
available cores or 8, whichever is lower.
--include/-i
Only include a selection of genomes.
--exclude/-e
Exclude a selection of genomes.
--annotations-file/-A
A text file with the identifiers of annotations to be included,
each on a separate line. The most recent annotation is selected
for genomes without an identifier.
--fast
Assume the optimal grouping is found when the F1-score drops
compared to the previous clustering round.
--longest
Only cluster protein sequences of the longest transcript per gene.
--scoring-matrix
The scoring matrix used, default is BLOSUM62.
--relaxation
Only consider a selection of relaxation settings (1-8 allowed).
After each clustering round, homology groups are incorporated in the
graph. A text file with homology group and gene identifiers is stored in
the group directory in the pangenome database. This file is named
after the used sequence similarity threshold (25-95). Each line
represents one homology group, starting with the homology group
(database) identifier followed by a colon (:) and mRNA identifiers (from
GFF) that are separated by a space. The mRNA identifiers are extended by
a hash (#) and their genome number. The following line is example output
of an homology group with two genes from genome 1 and 146:
Only a single homology grouping can be active in the pangenome. Use this
function to change the active grouping version. Information of the
available groupings and used settings is stored in the ‘pangenome’ node
(inside the database) and can be created by running
grouping_overview.
Parameters
<databaseDirectory>
Path to the database root directory.
Options
--grouping-version/-v
Required. The version of homology grouping to become active.
Delete all ‘homology_group’ nodes and ‘is_similar’ relations between
‘mRNA’ nodes from the database.
Parameters
<databaseDirectory>
Path to the database root directory.
Options
--fast
Do not remove the ‘is_similar’ relationships between mRNA nodes.
This does not influence the next grouping.
--grouping-version/-v
Select a specific grouping version to be removed. Should be either a
grouping number, ‘all’ for all groupings or ‘all_inactive’ for
all inactive groupings.
Reports the content of all (active & inactive) homology groups for the
different groupings in the pangenome. Include --fast into the
command to get a quick overview of the available groupings and the
settings that were used.
Parameters
<databaseDirectory>
Path to the pangenome database root directory.
Options
--fast
Only show which grouping is active and which groupings can be
activated.
Output files are written to /database_directory/group/
grouping_overview.txt, all homology groups in the pangenome. For
each homology group, the total number of members and the number of
members per per genome is reported.
current_pantools_homology_groups.txt, overview of the active
homology groups. Each line represents one homology group. The line
starts with the homology group (database) identifier followed by a
colon and the rest are mRNA IDs (from gff/genbank) separated by a
space.