Gene retention
Warning
This is a novel function and has not yet undergone testing by external users. Please report any bugs or issues to the PanTools team so we can improve it.
Visualize gene retention of sequences in reference to a target sequence. The retention can be based on homology or synteny. Protein sequences are required to be clustered with group (include hyperlink) for the homology-based method. Synteny information must be included into the pangenome with add_synteny to allow the visualization of based on the retention of syntenic genes.
--window-length) in steps of 10 gene positions.
Only the longest transcripts of genes are used.--selection-file.--coloring=phasing sequences belonging to the same chromosome get the same
color and the phasing (letter) determines the shade. Colors are shared in
the different figures of a combination plot for multiple genomes (see
example below). This currently coloring (currently) works up to 6
chromosomes (green, red, blue, purple, orange, yellow).--coloring=distinct uses up to 21 distinct colors to color line graphs.
Colors are not shared between figures of the combination plots with multiple
genomes.- Parameters
<databaseDirectory>
Path to the database root directory.
- Options
--window-lengthSet the sliding window length. Default is 100.
--sequences-plotSet the maximum number of sequences per (combination) plot. Default is 20.
--sequences-genomeSet the maximum number of sequences per genome plot. Default is 20.
--selection-fileText file with sequences (identifiers) that should be used as reference. Default is all sequences.
--include/-iOnly include a selection of genomes.
--exclude/-eExclude a selection of genomes
-—selection-fileText file with rules to use a specific set of genomes and sequences.
--coloringFor coloring the line graphs (“phasing” or “distinct”, see above). Reduces the maximum number of sequences per plot to 21.
- Example commands
$ pantools gene_retention apple_DB --phasing
$ pantools gene_retention apple_DB --phasing --window-length 50
$ pantools gene_retention apple_DB --mode distinct-colors
$ pantools gene_retention apple_DB --mode distinct-colors --selection-file ref_sequences.txt
- Example input
The
--selection-fileshould hold one sequence identifier per line. In the following example four sequences are selected to be used as reference. All other sequences are still considered as query sequence. Use-—selection-file,--inludeor--excludeto adjust the query sequences.1_1 1_2 2_1 3_1
- Output
Output files are written to the retention directory in the database. Up to two Rscripts (homologs and syntelogs) are created for the sequence selection, placed in a subfolder named after the reference sequence identifier.
retention_rscripts.sh, a shell script to execute all Rscripts.
- Example output
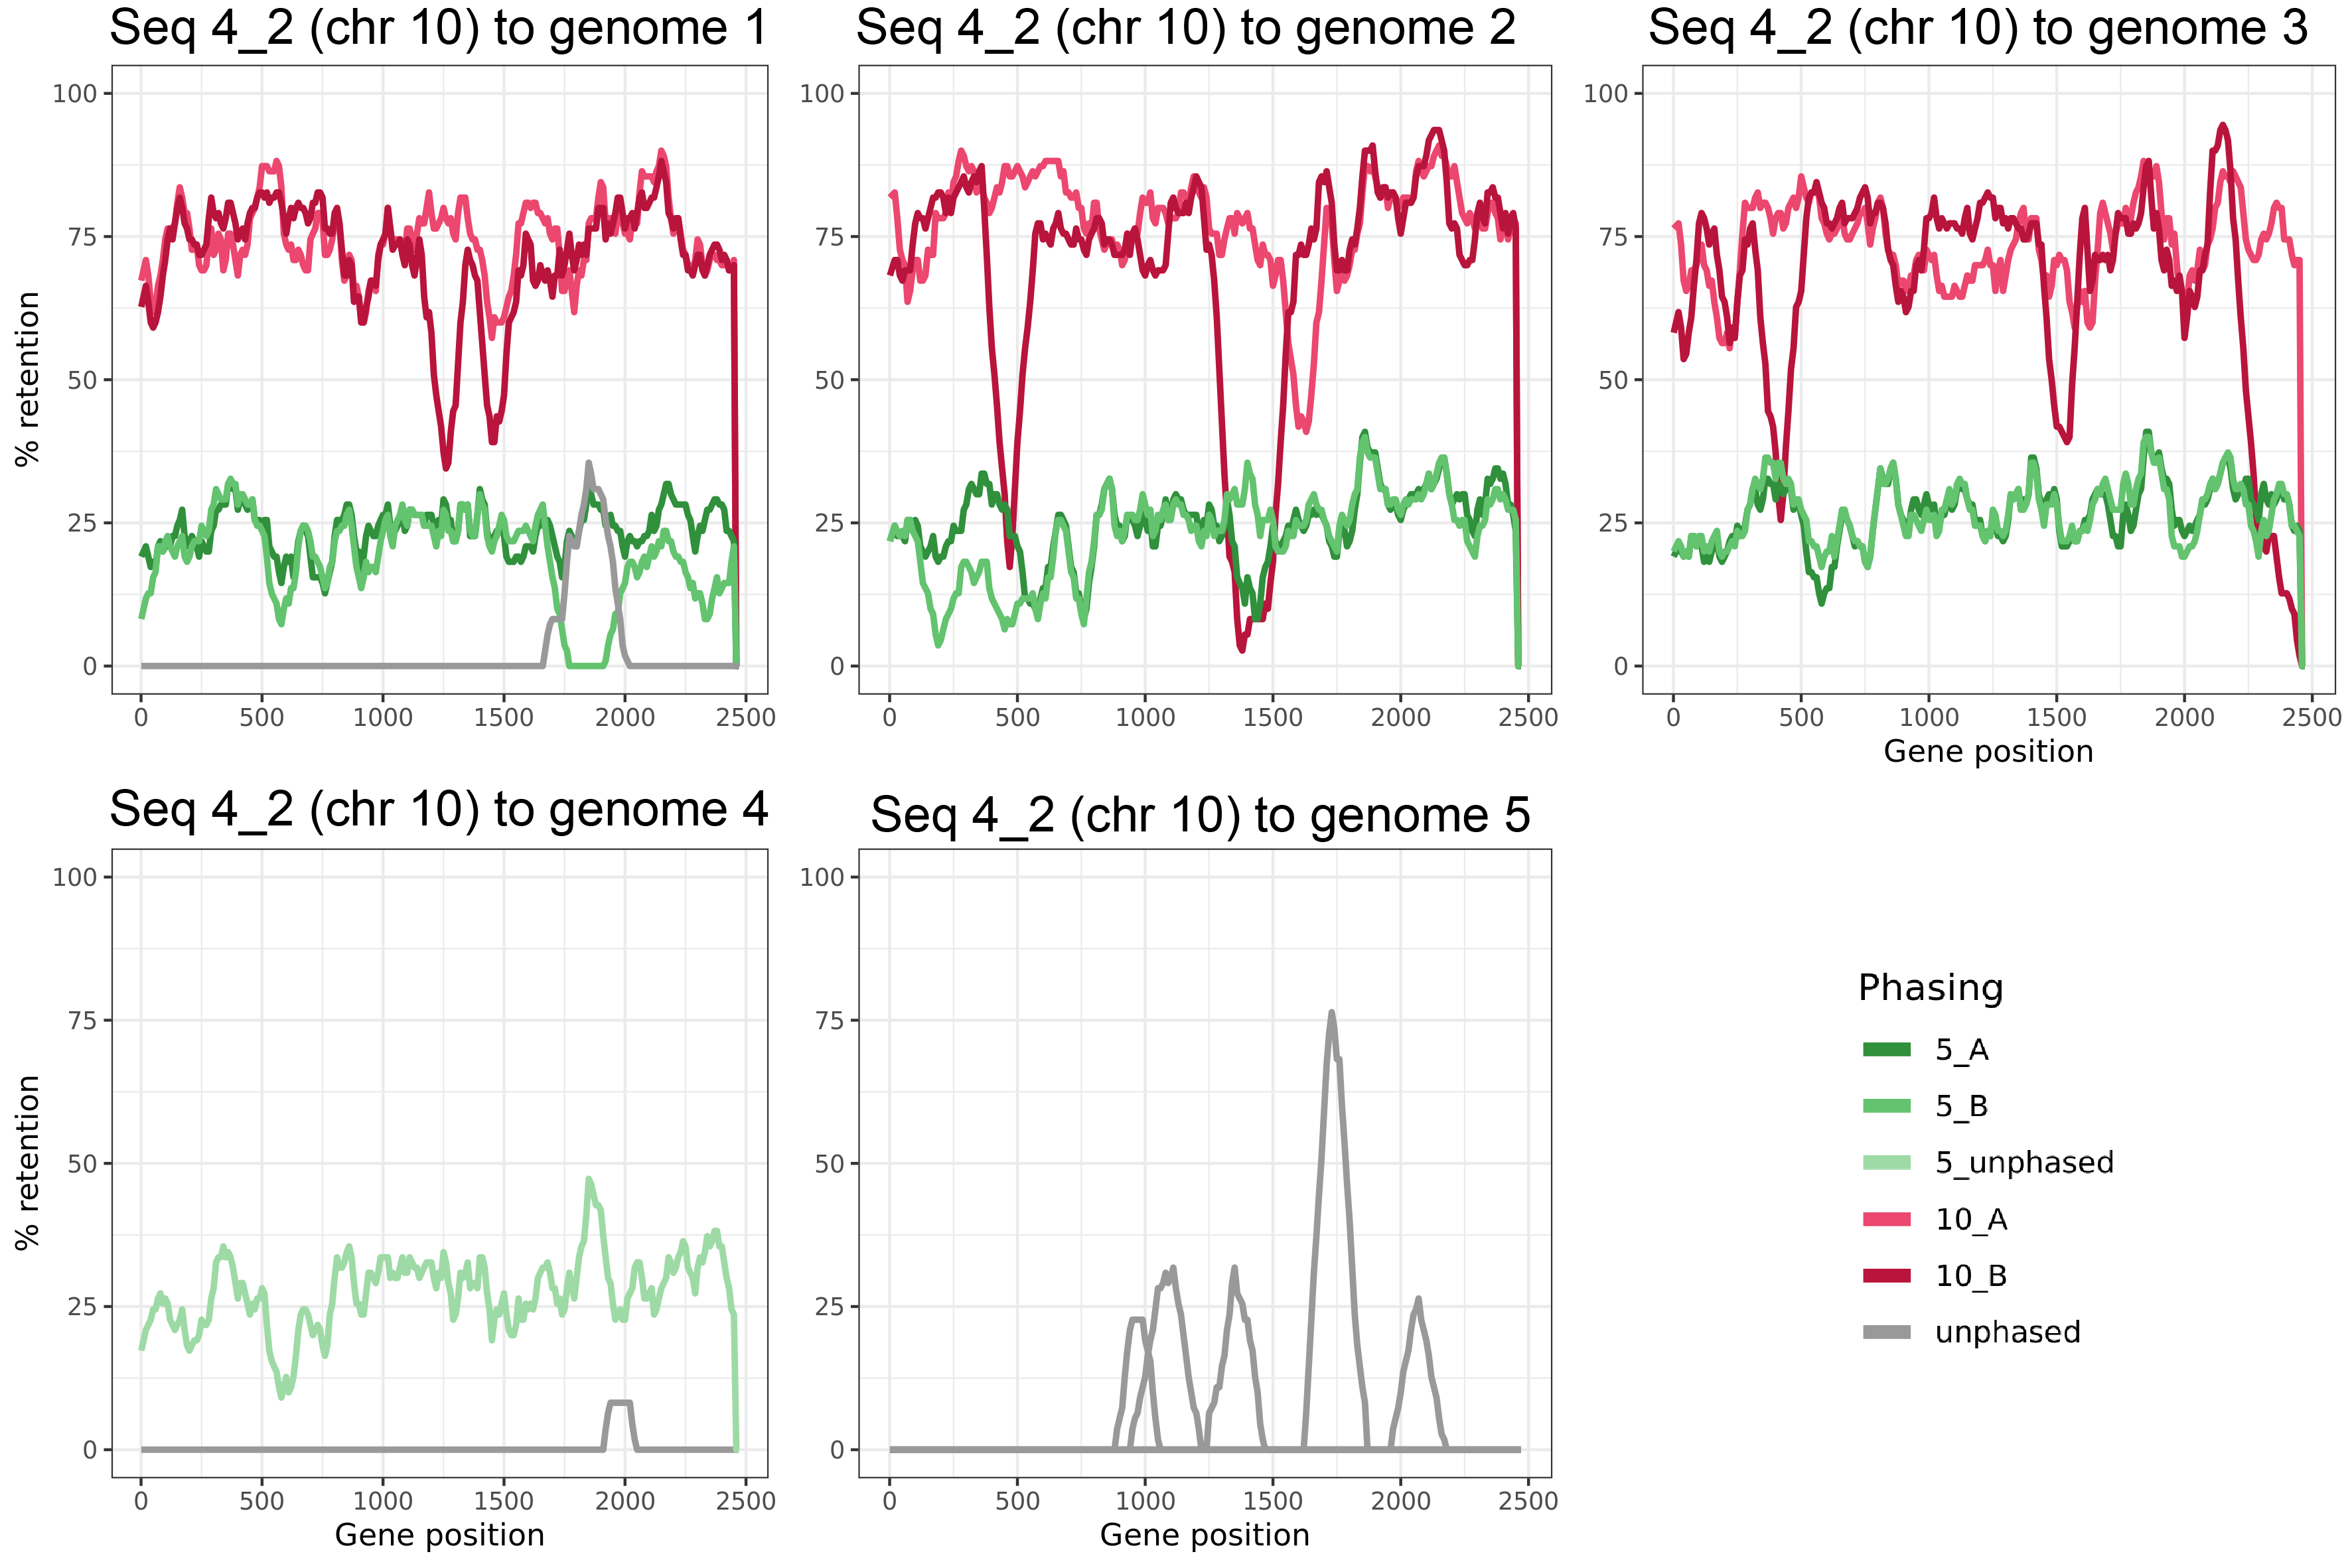
Fig. 16 Gene retention of Malus domestica cv Gala chr 10 to four other apple genomes. Genome 1-4 are chromosome-level assemblies, 1-3 are fully haplotype-phased. Genome 4 misses the red line because this was the selected reference sequence.