GO enrichment
For a given set of mRNA’s or homology groups, this function identifies over or underrepresented GO terms by using a hypergeometric distribution.
The p-value is calculated from the hypergeometric distribution
Parameter N = size of the population (Universe of genes).
Parameter n = size of the sample (signature gene set)
Parameter K = successes in population (enrichment gene set)
Parameter k = successes in sample (intersection of both gene sets)
Return the p-value of the Hypergeometric Distribution for P(X=k)
Prepare input for hypergeometric tests
The size and number of successes of the sample (n, k) and background (N, K) is prepared for each genome individually. Per genome, loops over every mRNA and checks for connected GO nodes. Each GO node connected to the mRNA is used to move up in the GO hierarchy via ‘is_a’ relations until the molecular_function, biological_process or cellular_component node is reached. Each GO term is counted only once per mRNA and a mRNA needs at least one GO term to be included in the sample and background sets. mRNA nodes which are part of the input homology groups are included into the sample set.
Multiple testing correction
Critical p-value using Bonferroni
For a GO germ to be significant, the p-value should be below 0.05 divided by number of tests per genome. For example, when 100 tests were performed, each p-value must be below 0.05/100 = 0.0005 to be considered significant.
Critical p-value using Benjamini-Hochberg procedure
Individual p-values are put in ascending order.
Ranks are assigned to the p-values. The lowest value has a rank of 1, the second lowest gets rank 2, etc..
The individual p-values Benjamini-Hochberg critical value is calculated using the formula \((i/m)Q\), where i is the individual p-values rank, m = total number of tests and Q is the false discovery rate.
Compare your original p-values to the critical B-H from Step 3; find the largest p value that is smaller than the critical value.
The critical p-value for the first rank for a total of 100 GO terms (tests) with a 5% false discovery rate is \((1/100) * 0.05 = 0.0005\). For the second and third rank this will be 0.0010 and 0.0015, respectively.
- Required software
dot. Although this function still works when dot is not (properly) installed, no visualizations of the GO hierarchy can be created.
- Parameters
<databaseDirectory>
Path to the pangenome database root directory.
- Options
Requires one of
--homology-file|--nodes.--homology-file/-HA text file with homology group node identifiers, separated by a comma.
--nodes/-nmRNA node identifiers, separated by a comma on the command line.
--include/-iOnly include a selection of genomes.
--exclude/-eExclude a selection of genomes.
--fdrThe false discovery rate (percentage), default is 5%.
- Example commands
$ pantools go_enrichment -H=unique_groups.txt tomato_DB
$ pantools go_enrichment --fdr=1 -i=1-3,5 -H=pheno_specific.txt tomato_DB
- Output
Output files are stored in /database_directory/function/go_enrichment/.
go_enrichment.csv, overview of all GO terms, p-values and the significance of enrichment. The output is formatted as a table.
go_enrichment_overview_per_go.txt, results of the analysis are ordered by GO term.
function_overview_per_mrna.txt, all functional annotations connected to the input sequences, ordered per mRNA.
function_overview_per_genome.txt, all functional annotations connected to the input sequences, ordered per genome.
Additional files are generated per individual genome and placed in /results_per_genome/.
go_enrichment.txt, list of GO terms, p-values and the critical p-values of Benjamin-Hochberg and Bonferroni.
revigo.txt, a list of GO terms and p-values that can be visualized on http://revigo.irb.hr
bio_process.pdf, dot visualisation of the Biological Process GO hierarchy.
cell_comp.pdf, dot visualisation of the Cellular Component GO hierarchy.
mol_function.pdf, dot visualisation of the Molecular Function GO hierarchy.
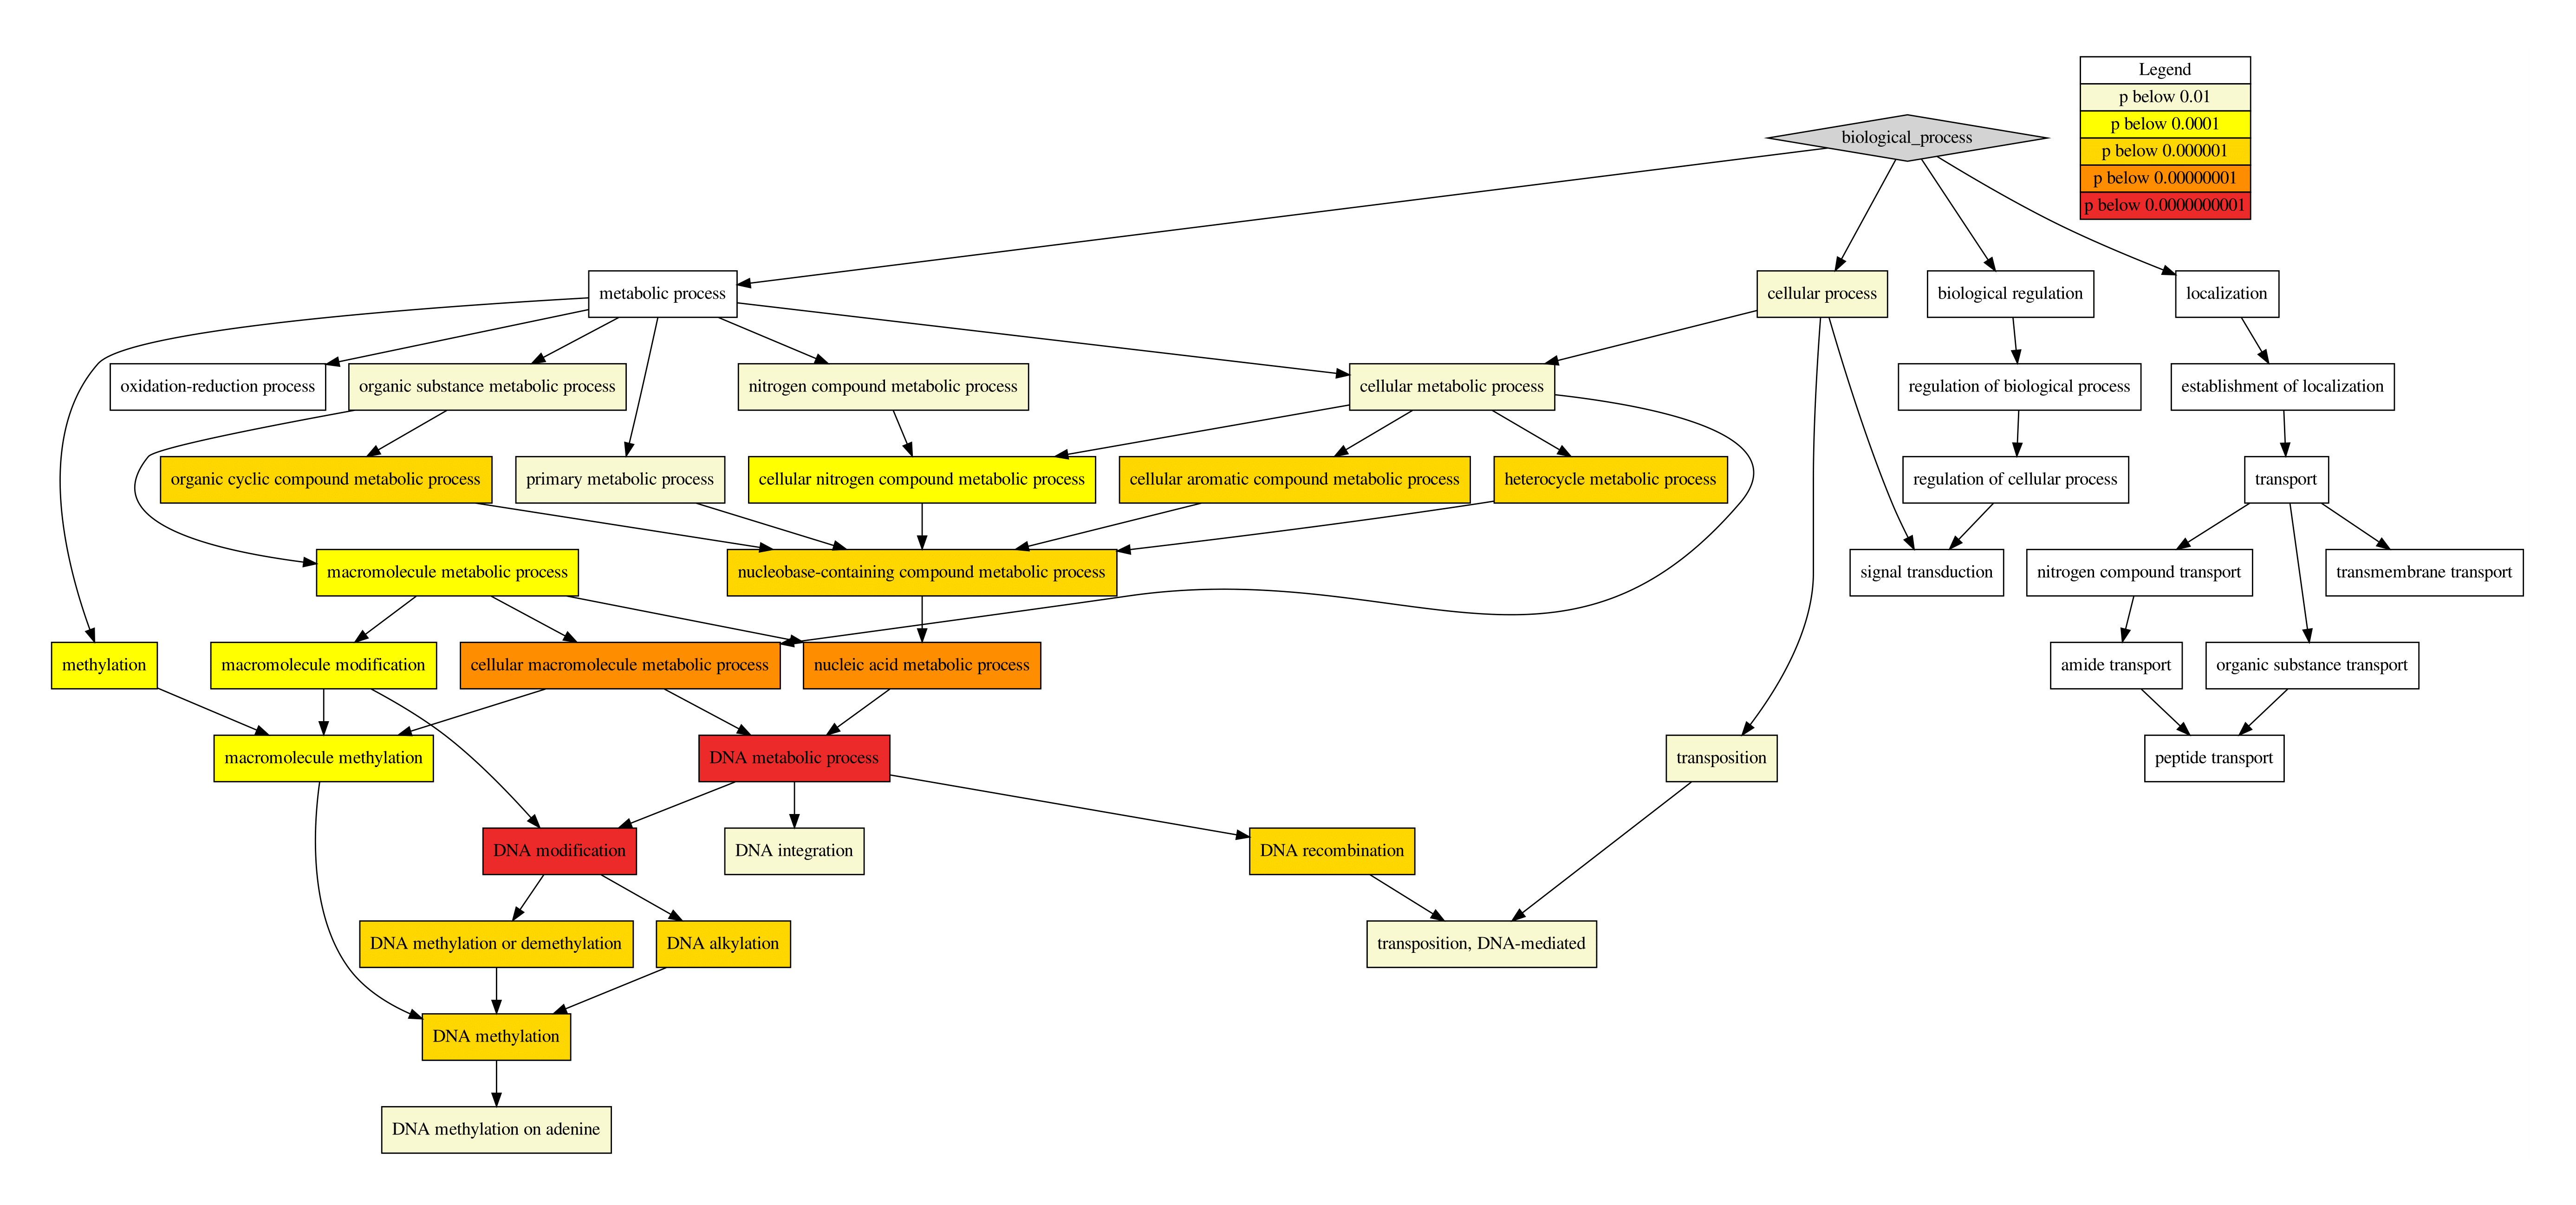
Fig. 17 Visualization of GO hierarchy by dot