Sequence visualization
Warning
This is a novel function and has not yet undergone testing by external users. Please report any bugs or issues to the PanTools team so we can improve it.
Generate a visualization of multiple sequences with annotation bars.
Annotation bar types
Gene and repeat coverage. Percentage of repeat and gene coverage calculated within a sliding window on the sequence. A coverage of 100% means every nucleotide of the window is covered.
Found in other chromosome. The gene region is only visible if the gene is also found on another chromosome.
Gene classification. Genes are coloured according their category: core, accessory or unique.
Haplotype presence. Genes are coloured by the number of haplotypes (phases) they are found in.
Synteny. Syntenic blocks are drawn between two sequences.
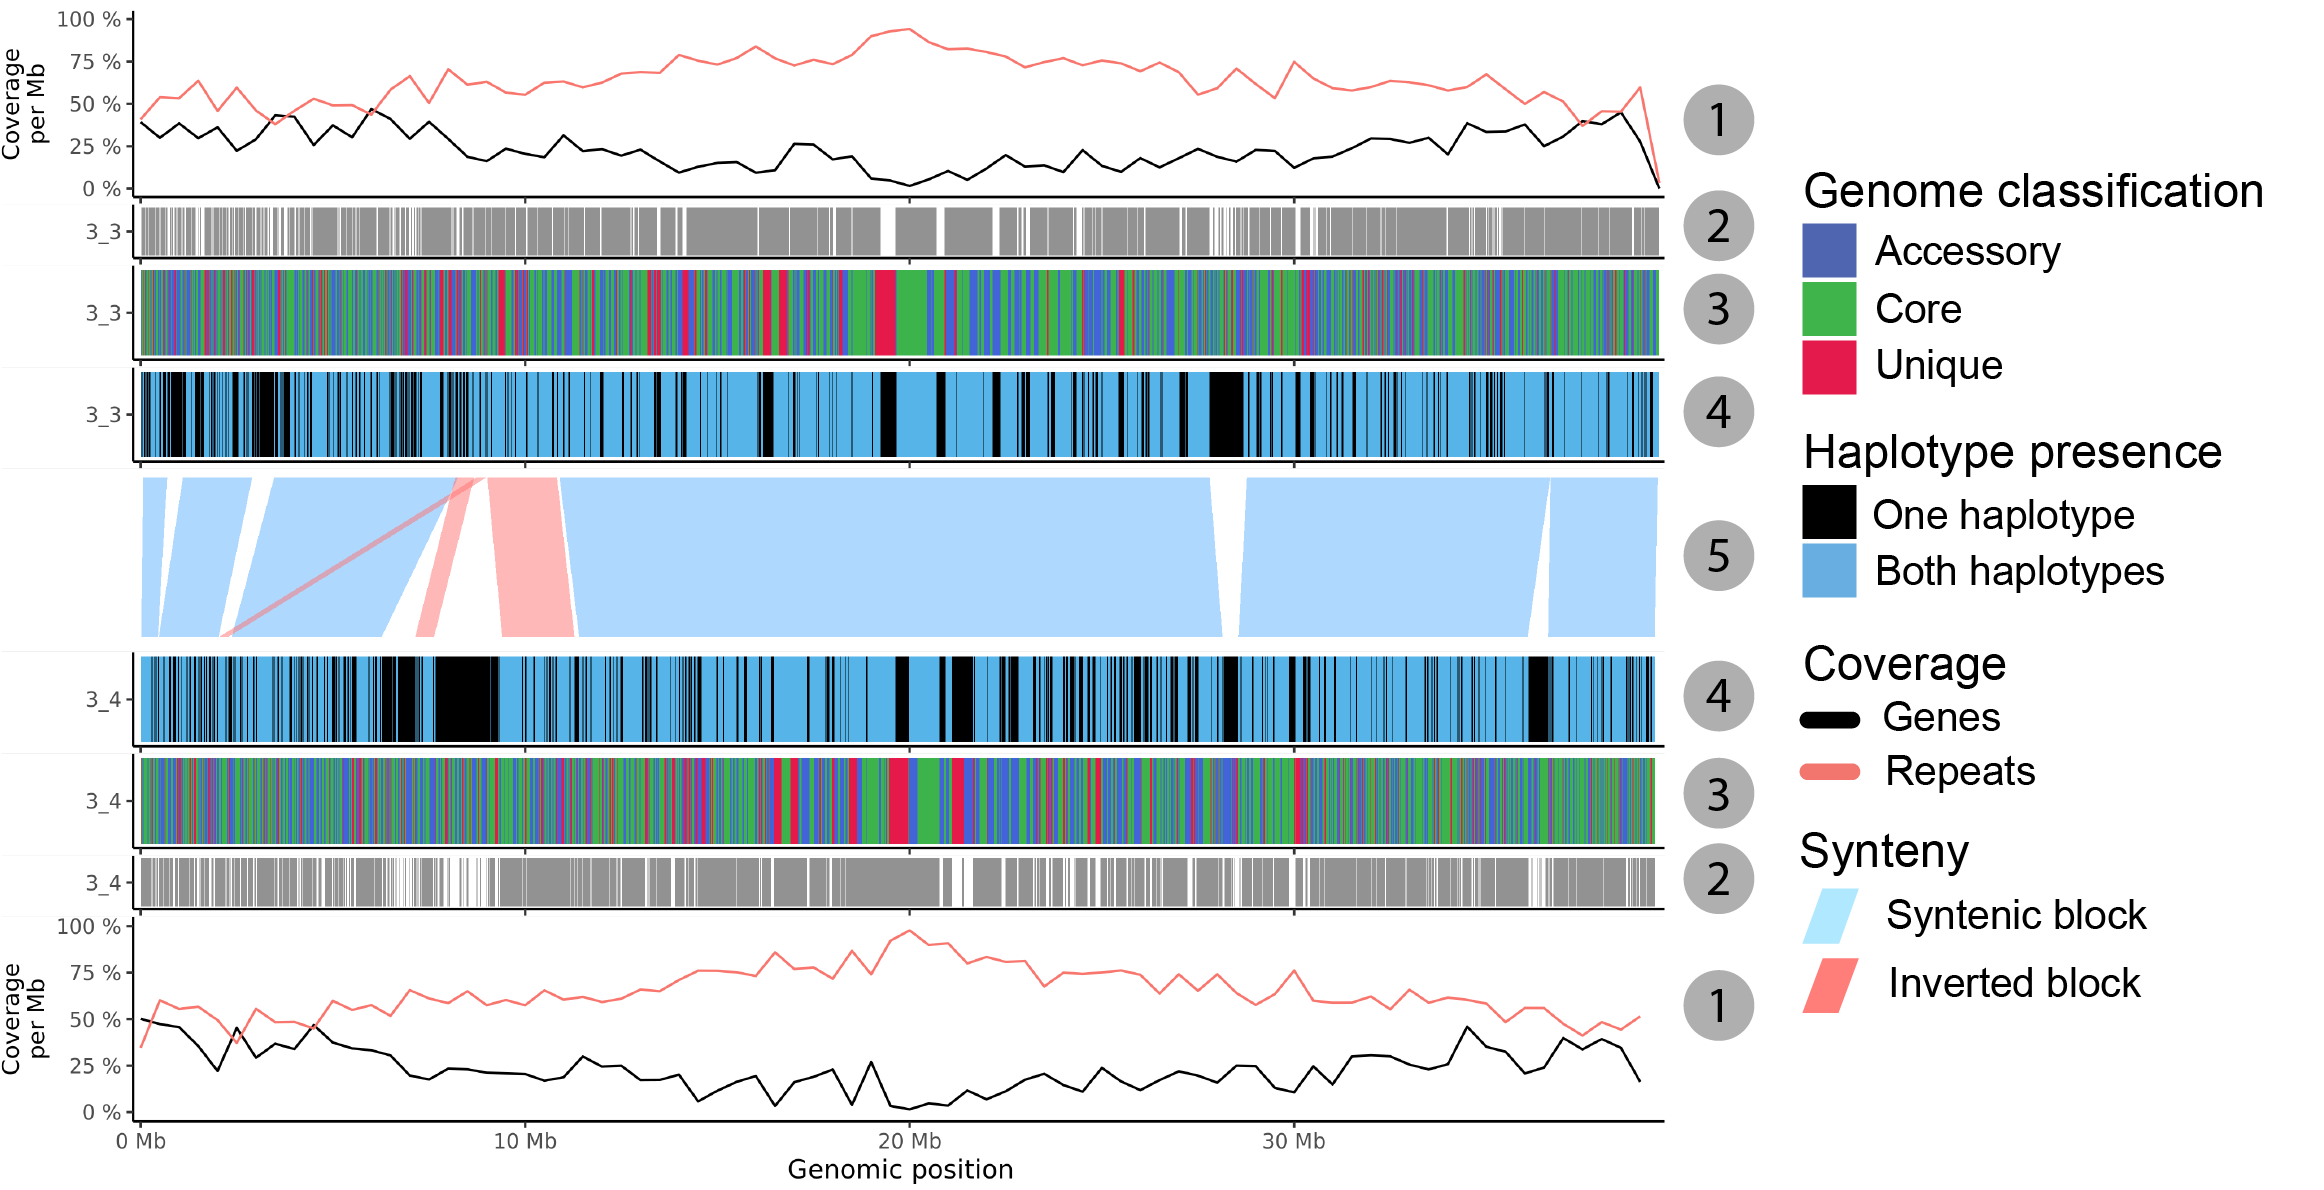
Fig. 18 Annotation plot for two sequences with all possible annotation bars.
--window-size.--phasing
argument.--sequence argument for the synteny calculation
as the default is only between genomes.- Parameters
<databaseDirectory>
Path to the database root directory.
- Options
--include/-iOnly include a selection of genomes. This automatically lowers the threshold for core genes.
--exclude/-eExclude a selection of genomes. This automatically lowers the threshold for core genes.
-—selection-fileText file with rules to use a specific set of genomes and sequences. This automatically lowers the threshold for core genes.
--rulesText file with set of rules to determine which bar types and wha sequences (in which specific order) should be visualized.
- Example commands
$ pantools sequence_visualization tomato_DB
$ pantools sequence_visualization tomato_DB --rules rules.txt
- Example input
Rules set by the
--rulesfile determine which bar types, in which order, and for which sequences they should be visualized.Include all possible visualization and include all sequences (with phasing information).
gene_classification
haplotype_presence
other_chromosomes
repeat_coverage
gene_coverage
Visualize the haplotype counts for all sequences with phasing information.
haplotype_presence
Create one plot that visualizes the haplotype counts for the four sequences (with phasing information).
sequence 1_2,1_3,1_1,1_2
haplotype_presence
- Output
Output files are written to the sequence_visualization directory in the database.
plot_sequences.R, Rscript to visualize the annotation bars. This script is created when a sequence selection was made using the sequence rule.
run_visualization_scripts.sh, shell script to execute all Rscripts. This script is only generated when there is phasing information (add_phasing) and no sequence selection was made.
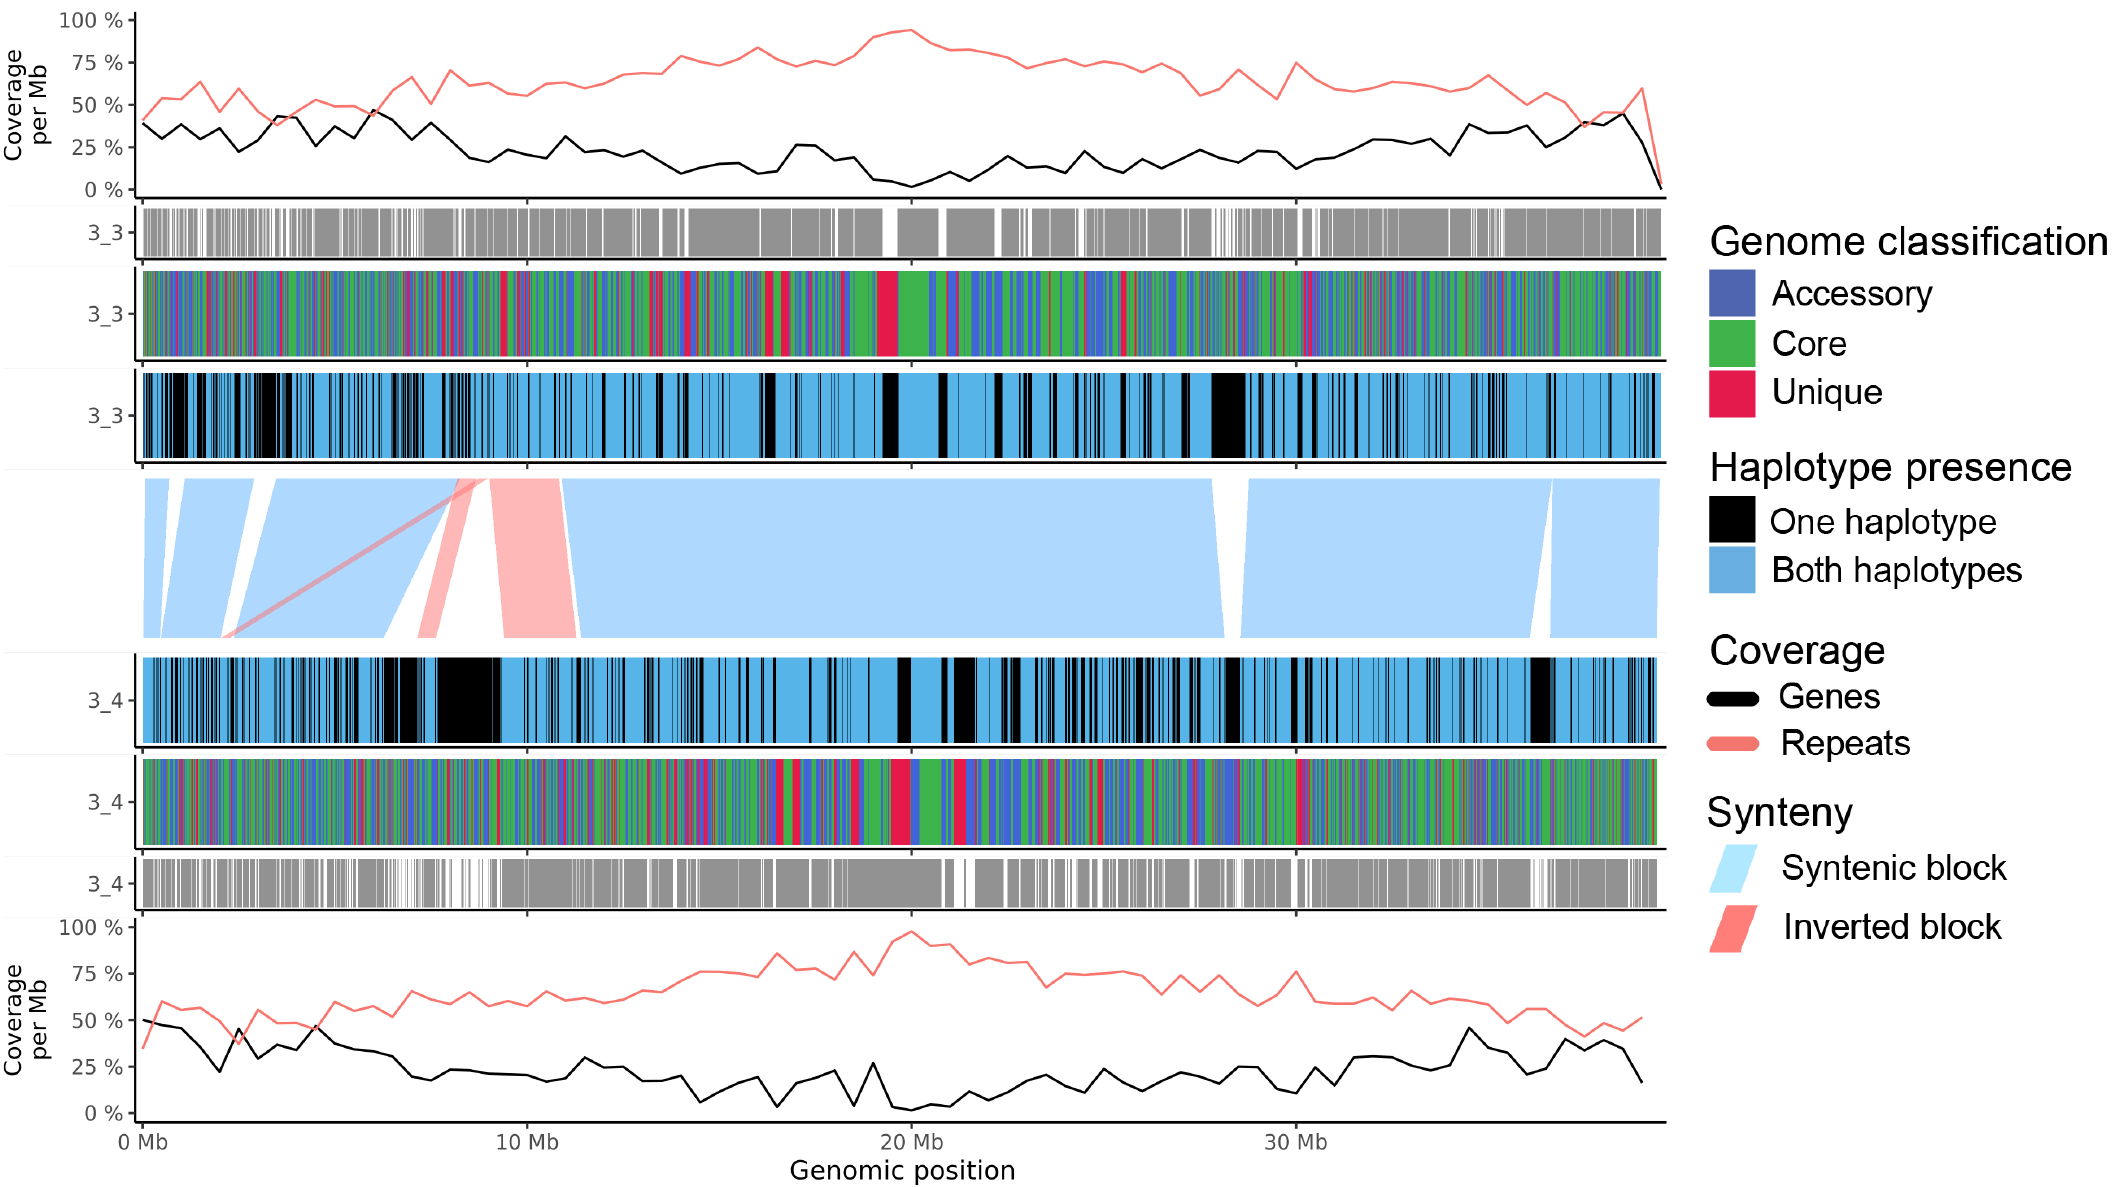
Fig. 19 Sequence plot for two sequences with all possible annotation bars.
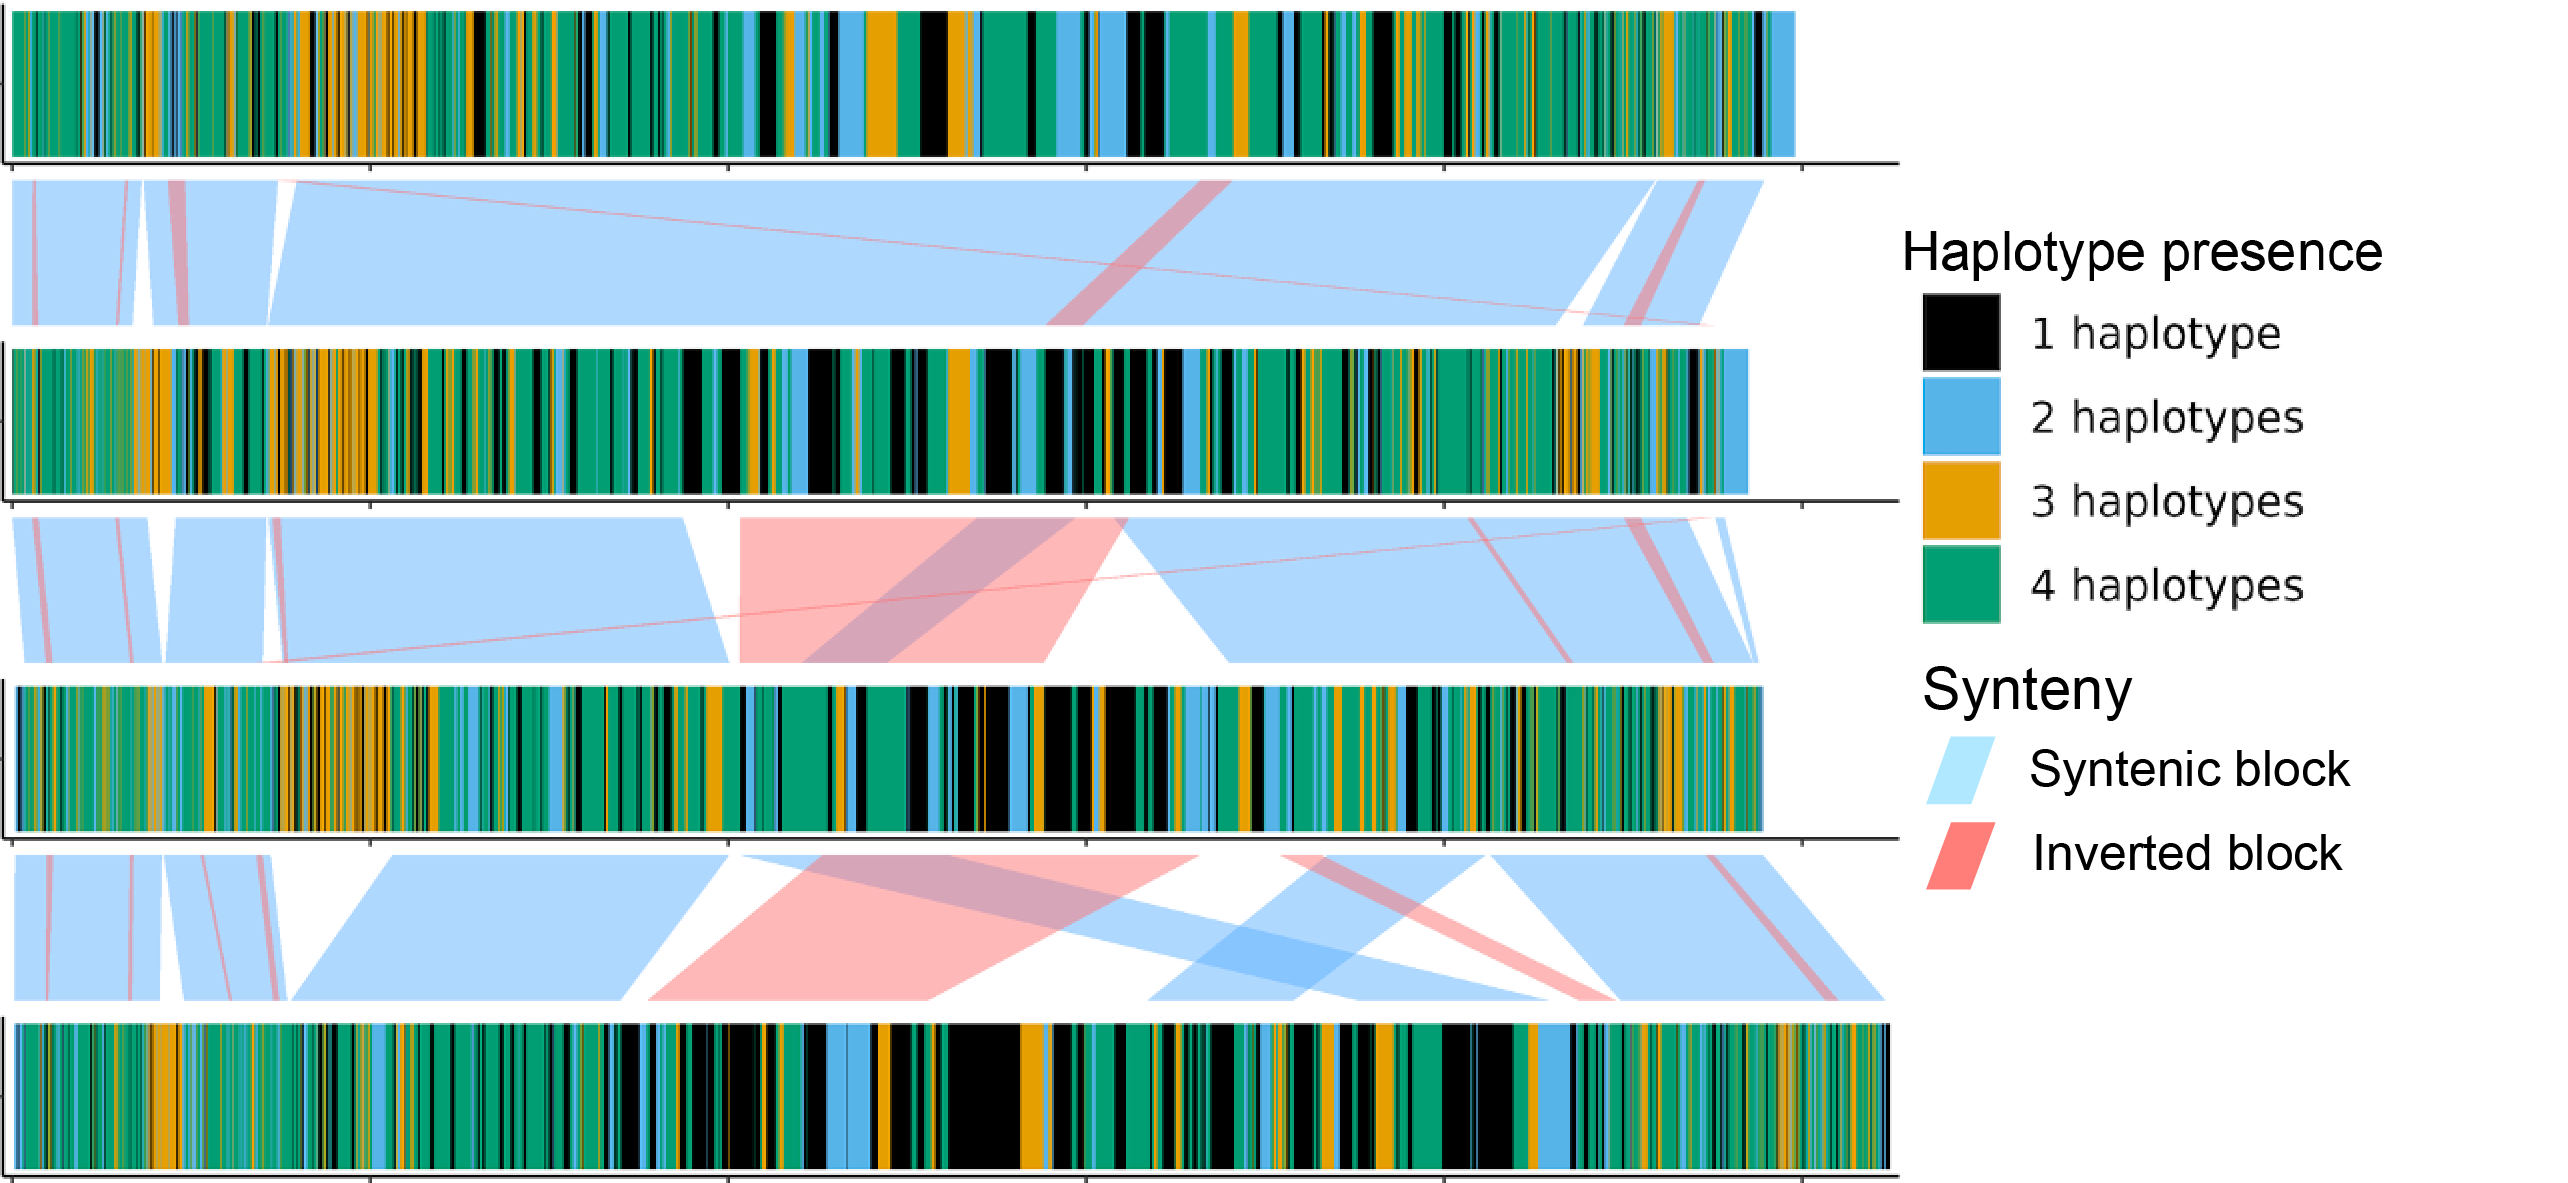
Fig. 20 Sequence plot of four sequences with haplotype copies bars.
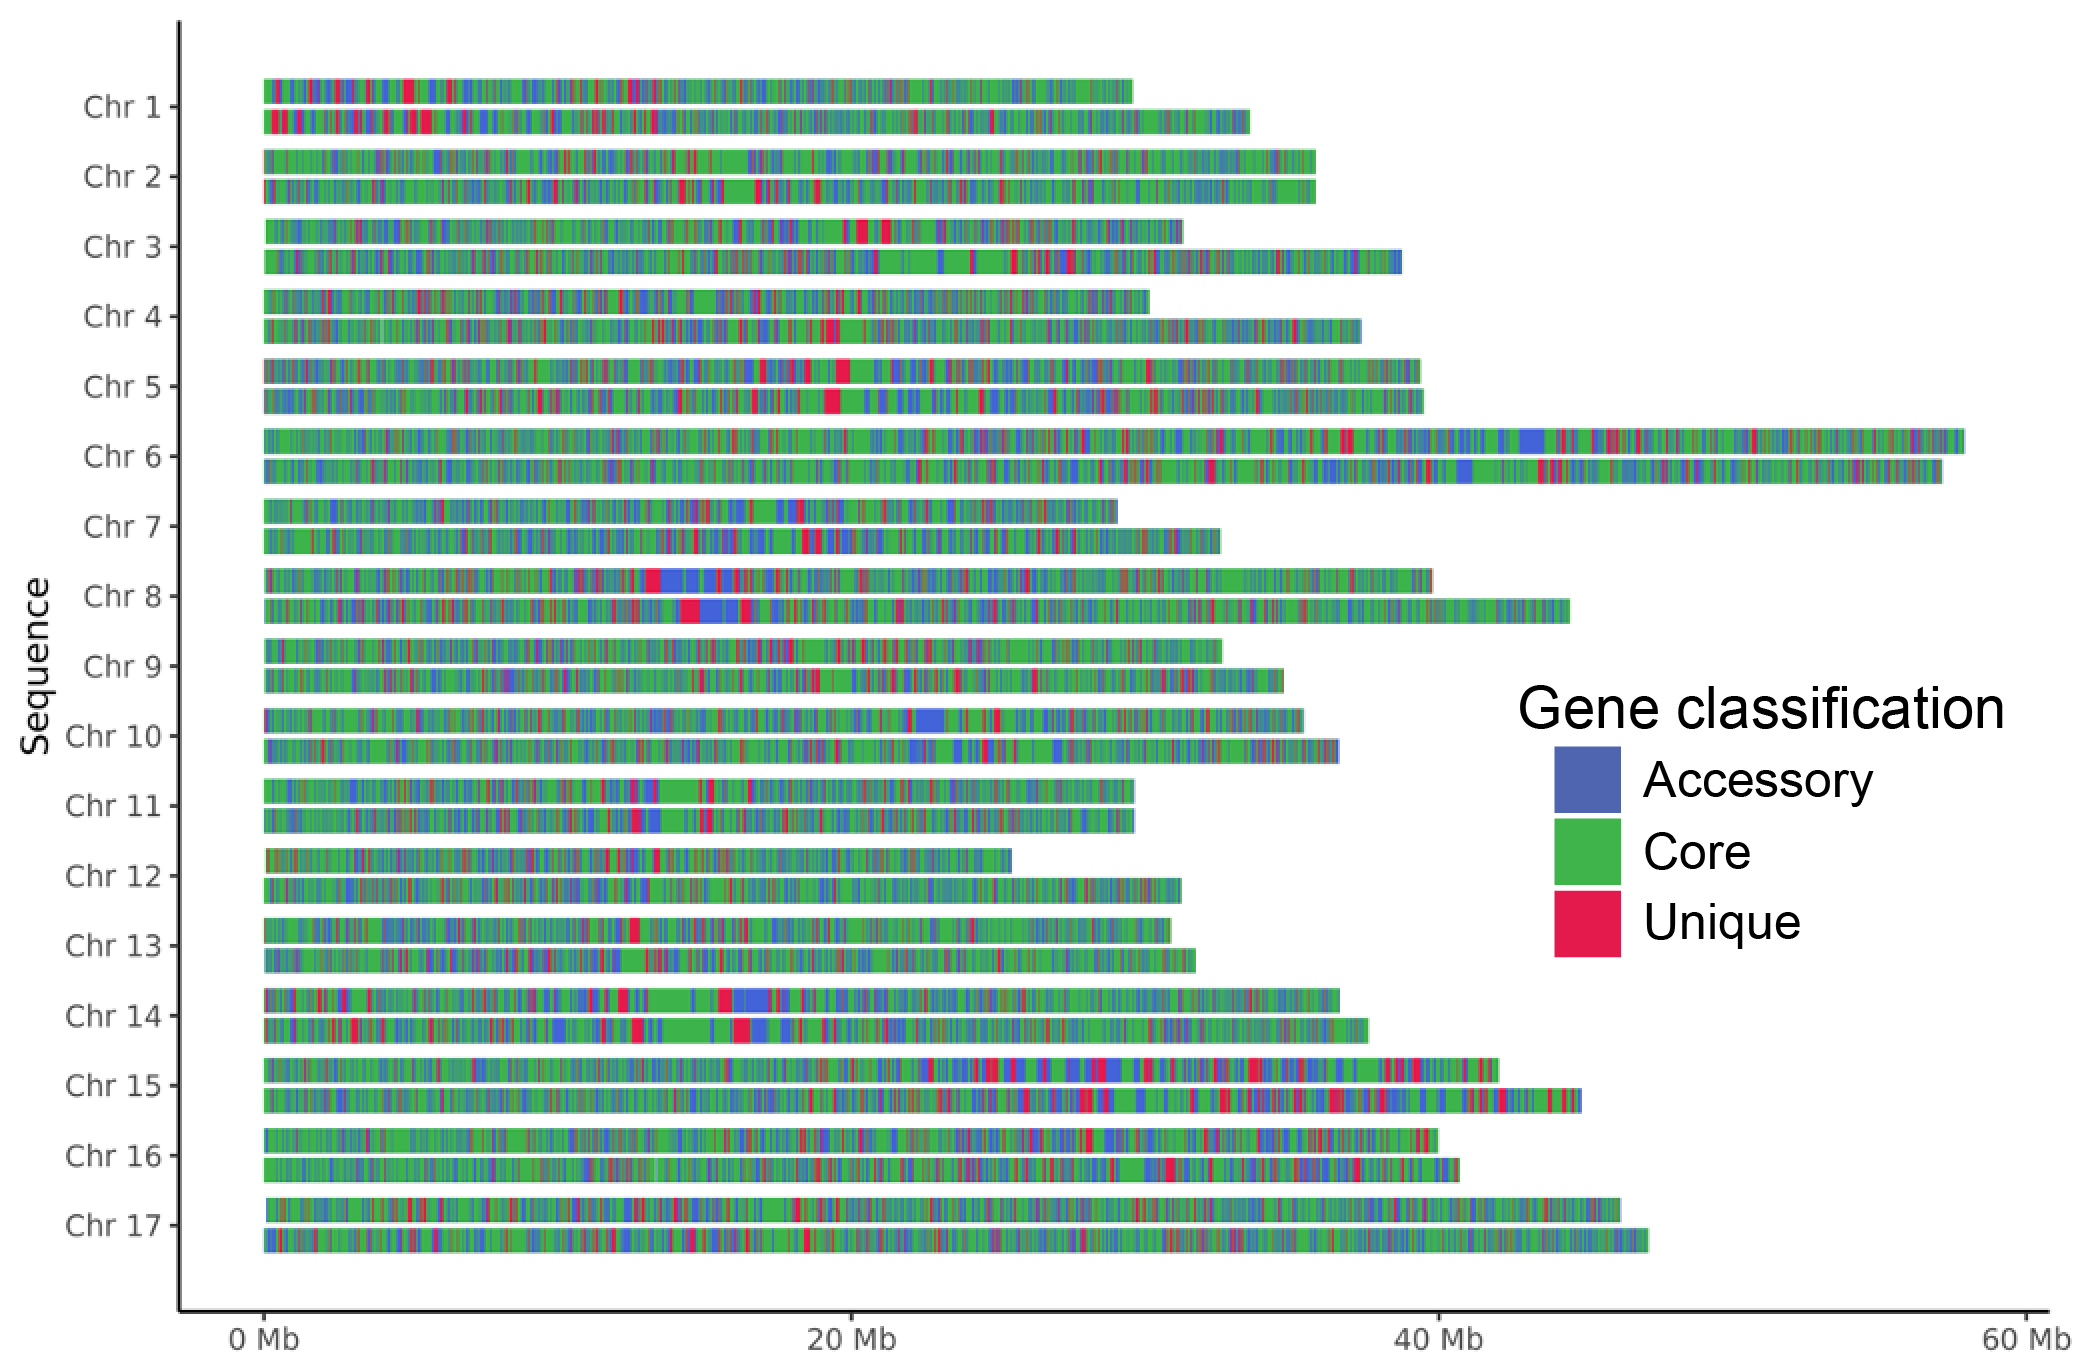
Fig. 21 Genome plot with core, accessory and unique bars. Diploid apple genome.
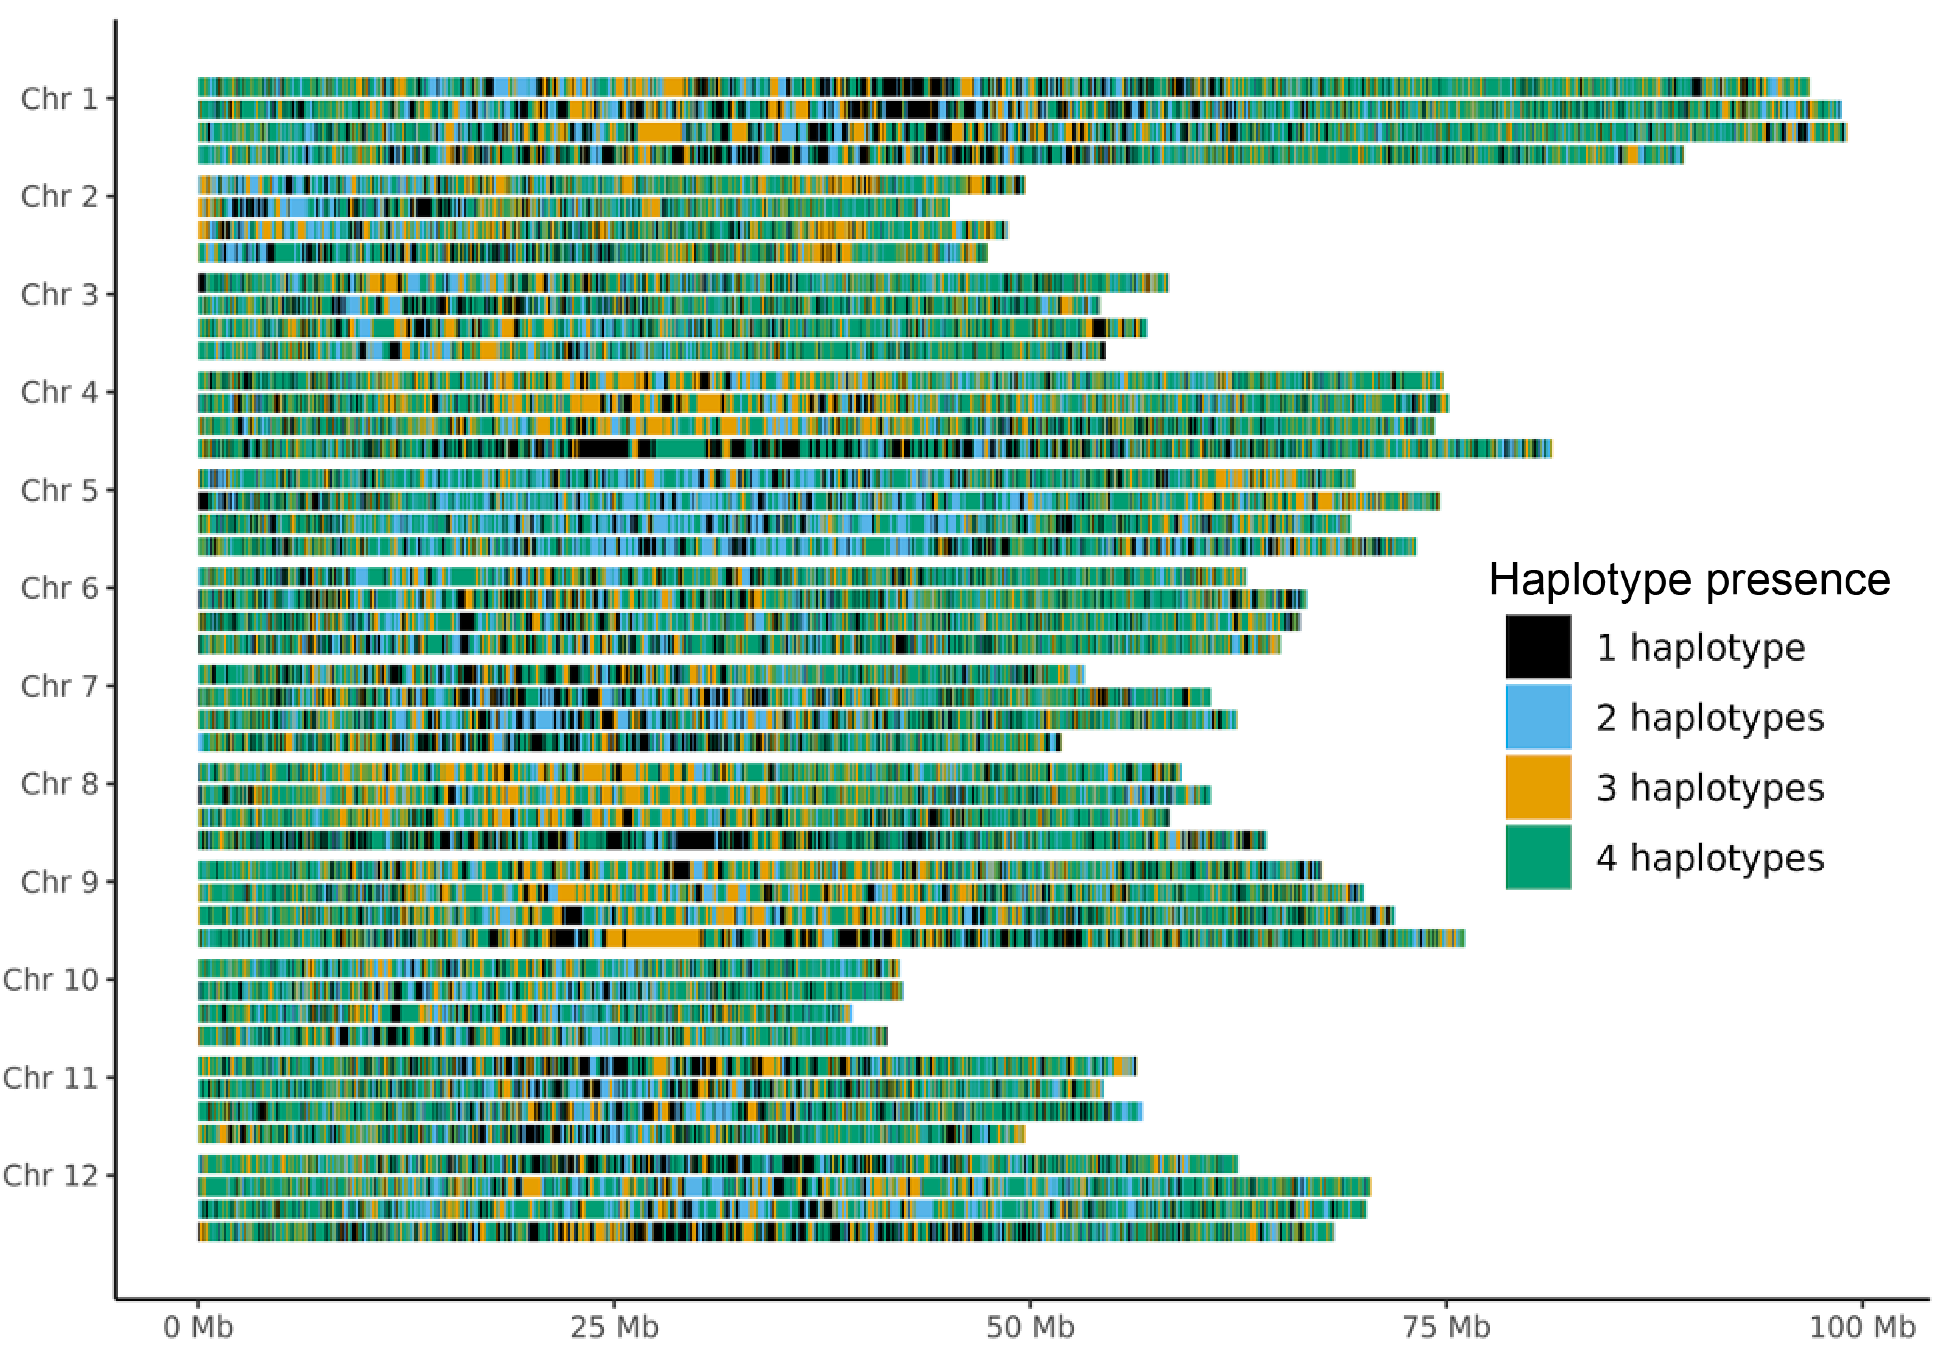
Fig. 22 Genome plot with haplotype copies bars. Tetraploid potato genome.