Classification
Functionalities for classifying a pangenome based on genes, k-mer sequences and functions. In this manual we use several pangenome related terms with the following definitions:
Core, an element is present in all genomes
Unique, an element is present in a single genome
Accessory, an element is present in some but not all genomes
When phenotype information is used in the analysis, three additional categories can be assigned:
Shared, an element present in all genomes of a phenotype
Exclusive, an element is only present in a certain phenotype
Specific, an element present in all genomes of a phenotype and is also exclusive
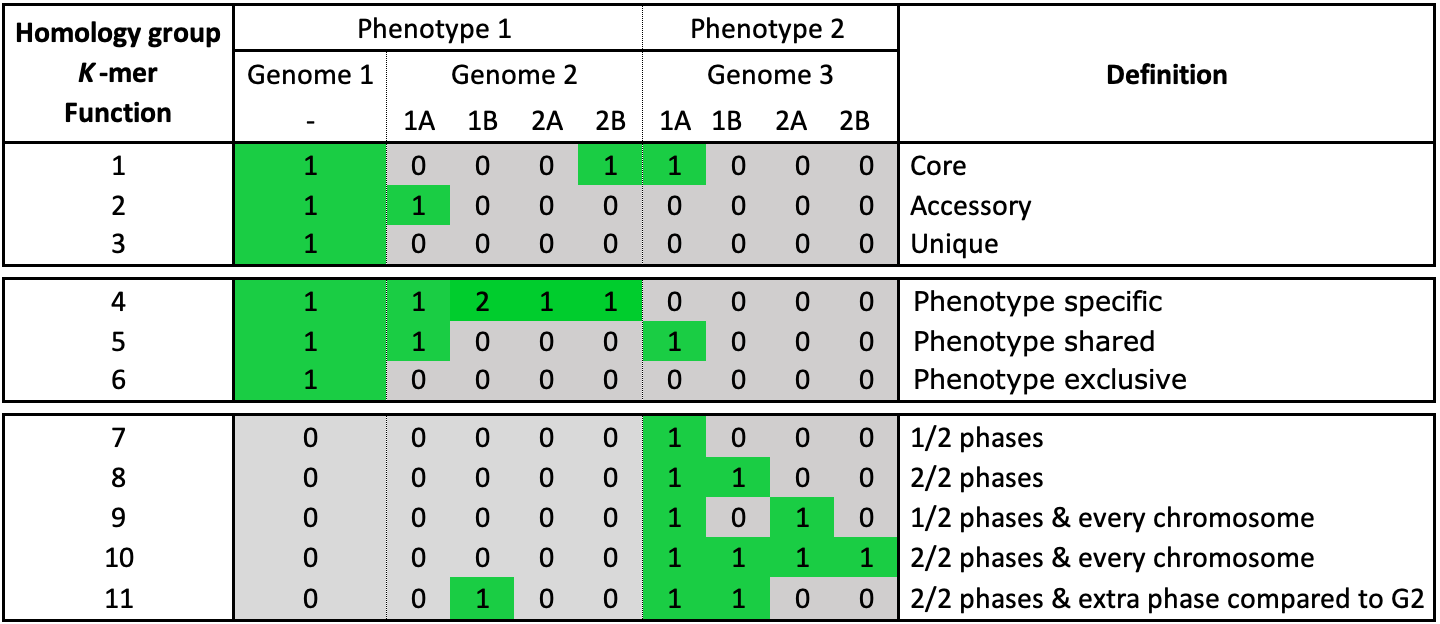
Fig. 13 The possible classification categories for genes, k-mers and functions. Genome 2 and 3 have phasing information added. Both genomes have two chromosomes that consist of two phases. The core, accessory, unique and phenotype categories work on a genome level.
Gene classification
Classification of the pangenome’s gene repertoire. Homology groups are utilized to identify shared genes between genomes. The default criteria for defining the category of a gene is shown in Fig. 13.
To identify soft core and cloud genes, the core and unique thresholds (%)
can be relaxed by --core-threshold and --unique-threshold,
respectively. The --phenotype-threshold argument can be used to
lower the threshold for phenotype specific and shared homology groups.
- Parameters
<databaseDirectory>
Path to the database root directory.
- Options
--include/-iOnly include a selection of genomes. This automatically lowers the threshold for core genes.
--exclude/-eExclude a selection of genomes. This automatically lowers the threshold for core genes.
-—selection-fileText file with rules to use a specific set of genomes and sequences. This automatically lowers the threshold for core genes.
--phenotype/-pA phenotype name, used to find genes specific to the phenotype.
--mlsaFinds suitable single-copy groups for a MLSA.
--core-thresholdThreshold (%) for (soft) core genes. Default is 100% of genomes.
--unique-thresholdThreshold (%) for unique/cloud genes. Default is a single genome, not a percentage.
--phenotype-thresholdThreshold (%) for phenotype specific/shared genes. Default is 100% of genomes with phenotype.
--pavsUse PAV information in the classification. Cannot be used with
--mlsaand--phenotype.--phasingUse phasing information to count genes between haplotypes.
--sequencePerform the analysis on a sequence level in addition to the genome. Is automatically set when
--phasingis included.- Example commands
$ pantools gene_classification tomato_DB
$ pantools gene_classification --unique-threshold=5 --core-threshold=95 tomato_DB
$ pantools gene_classification --phenotype=resistance --exclude=2,3 --phenotype-threshold=95 tomato_DB
$ pantools gene_classification --pavs tomato_DB
- Output
Output files are written to the gene_classification directory in the database.
gene_classification_overview.txt, statistics of the core, accessory, unique groups of the pangenome and individual genomes.
classified_groups.csv, the classified homology groups formatted as the table in the example table above.
cnv_core_accessory.txt, core and accessory groups with genomes that have additional copies compared to the lowest number (at least 1) in the group.
group_size_occurrence.txt, number of times a group of a certain size occurs in the pangenome. The homology group sizes can be based on the number of proteins or the number of genomes.
gene_distance_tree.R, an R script to cluster genomes based on gene distance (absence/presence). For more information, see the Gene distance tree manual.
shared_unshared_gene_count.csv, six tables with the number of shared and unshared genes between genomes: all genes, distinct genes and informative distinct genes. To get the number of distinct genes, additional copies of a gene within a homology group are ignored. Genes are considered informative when shared by at least two genomes.
sequence.csv, tables with gene counts and calculated percentages. The gene counts and percentages are based on number of shared and unshared genes between genomes: all genes, distinc genes and informative distinct genes. To get the number of distinct genes, additional copies of a gene within a homology group are ignored. Genes are considered informative when shared by at least two genomes. The sequence level percentages only generated when
--sequenceis included.
The following files contain homology group node identifiers.
all_homology_groups.csv, the node identifiers of all homology groups.
core_groups.csv, the node identifiers of the core homology groups.
single_copy_orthologs.csv, the node identifiers of single-copy ortholog groups. This is a subset of the core set where each genome is only allowed to have a one copy of a gene.
accessory_groups.csv, the node identifiers of accessory homology groups. The groups are ordered (in descending order) by the group size based on the total number of genomes present.
accessory_combinations.csv, the node identifiers of accessory homology groups, ordered by the combination of genomes by which they are shared.
unique_groups.csv, the node identifiers of unique homology groups ordered by genome.
phenotype_specific_groups.csv, the node identifiers of phenotype specific homology groups.
phenotype_shared_groups.csv, the node identifiers of phenotype shared homology groups.
phenotype_exclusive_groups.csv, the node identifiers of phenotype exclusive homology groups.
sequence_combinations.csv, identifiers ordered by the combination of sequence (identifiers) by which they are shared.
Additional files are generated when the
--phenotypeargument is included.gene_classification_phenotype_overview.txt, the number of identified phenotype shared and specific groups.
phenotype_disrupted.txt, this file shows which proteins prevented phenotype shared groups to be specific.
phenotype_cnv, homology groups where all members of a phenotype have at least one additional copy of a gene compared to one of the other phenotypes.
phenotype_association.csv, results of performed Fisher exact tests on homology groups with an unequal proportion of phenotype members.
When
--mlsais includedmlsa_suggestions.txt, a list of single copy ortholog genes all having the same gene name. This file cannot be created when using a panproteome.
Core unique thresholds
Runs a simplified version of the gene_classification function to
test the effect of different --core-threshold and
--unique-threshold cut-offs between 1 and 100%.
- Parameters
<databaseDirectory>
Path to the pangenome database root directory.
- Options
--include/-iOnly include a selection of genomes. This automatically lowers the threshold for core genes.
--exclude/-eExclude a selection of genomes. This automatically lowers the threshold for core genes.
- Example commands
$ pantools core_unique_thresholds tomato_DB
$ pantools core_unique_thresholds --exclude=1,2,5-10 tomato_DB
$ R script tomato_DB/R_scripts/core_unique_thresholds/core_unique_thresholds.R
- Output
Output files are written to core_unique_thresholds directory in the database.
core_unique_thresholds.csv, the number of (soft) core unique/cloud homology groups for all tested thresholds.
core_unique_thresholds.R, the R script plots the number of (soft) core unique/cloud homology groups for all tested thresholds.
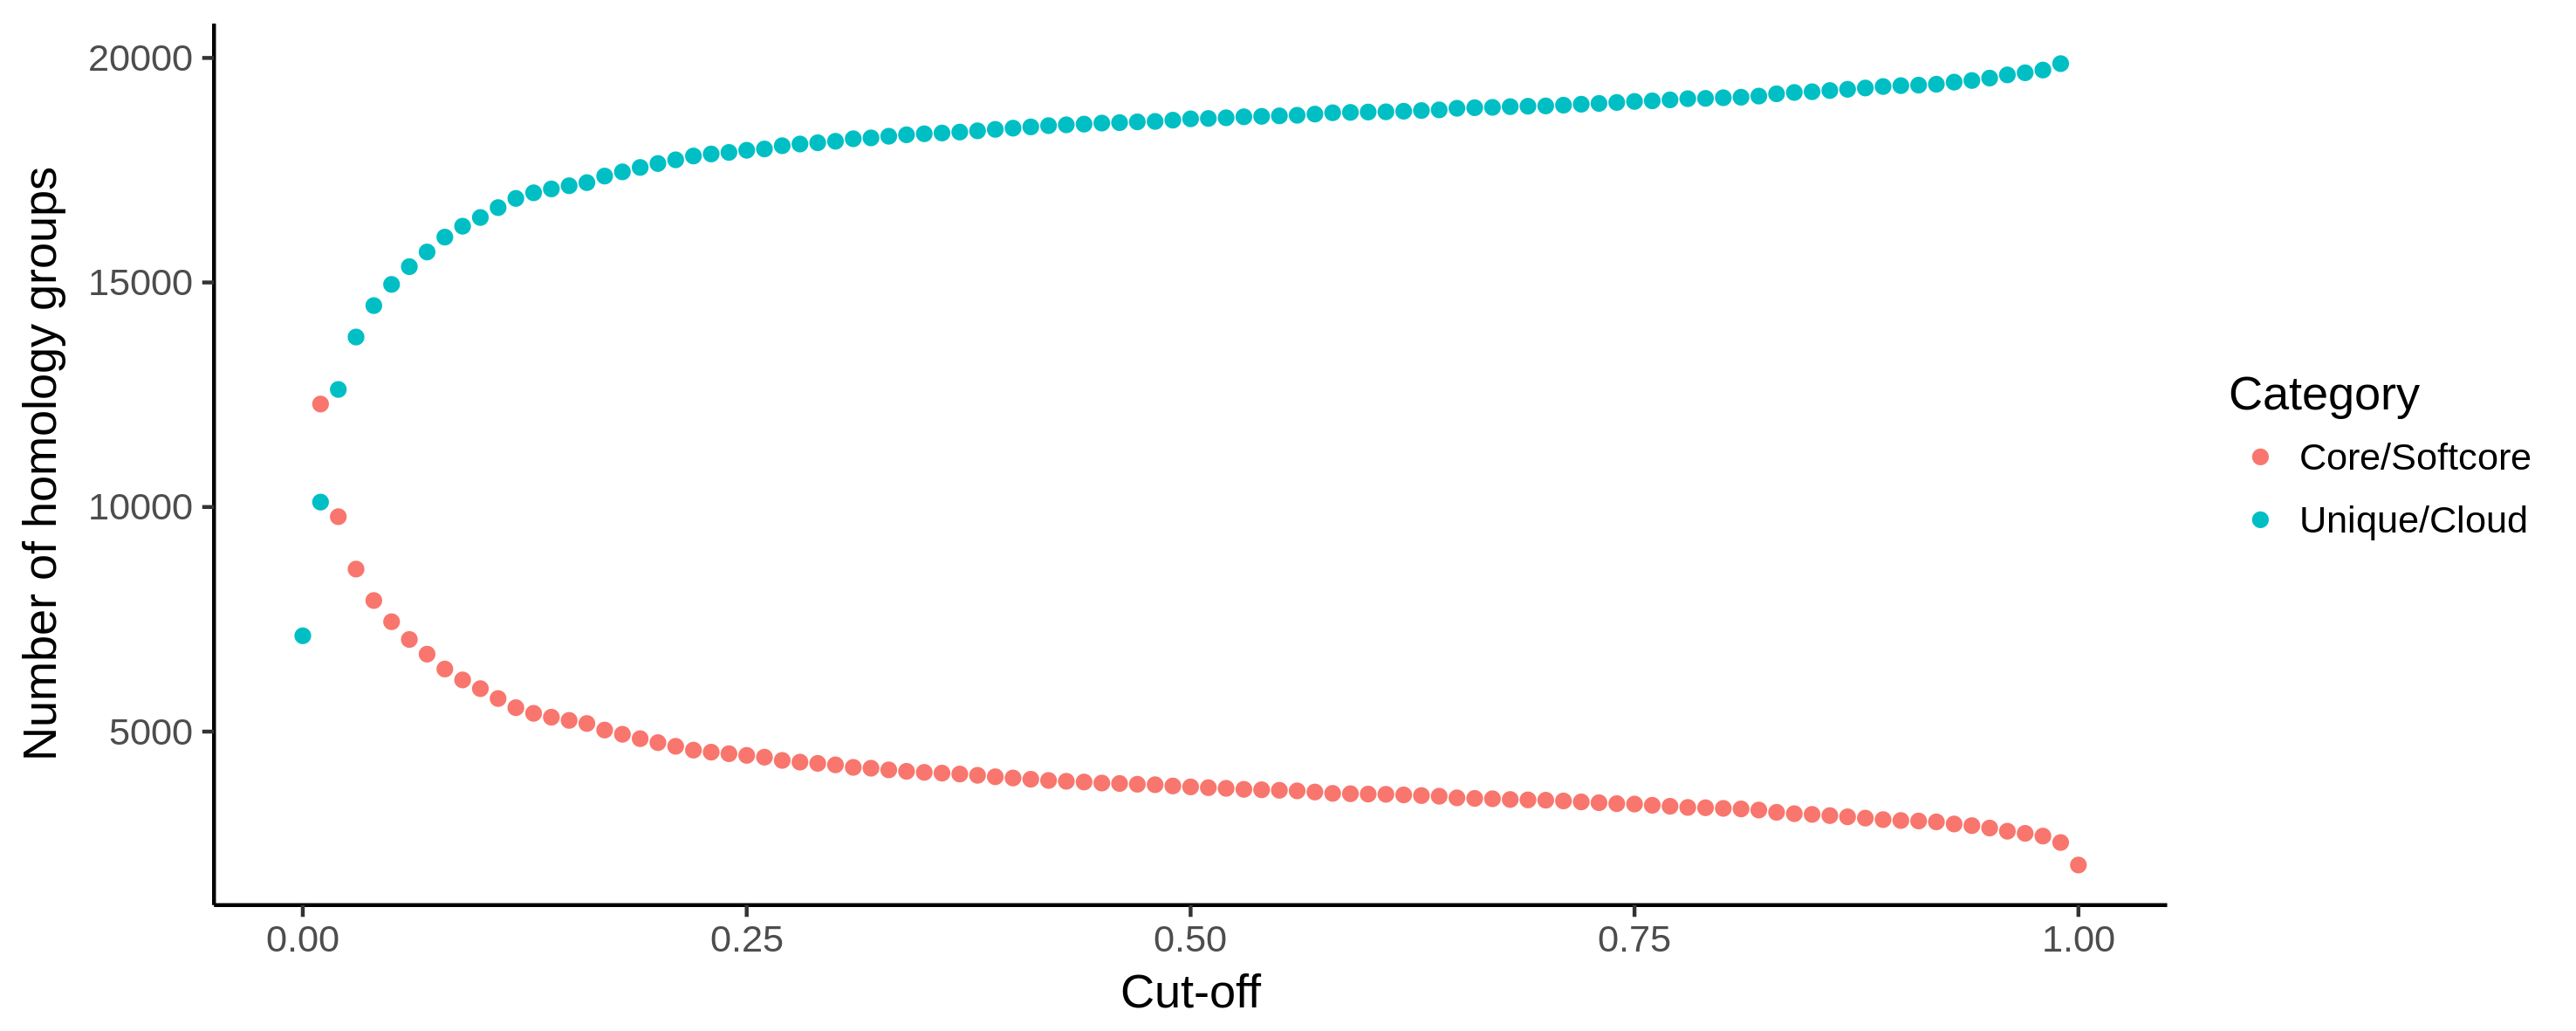
Fig. 14 Example output of core_unique_thresholds.R on a pangenome of 197 Pectobacterium genomes demonstrates the effect of loosening the thresholds. The number of (soft) core (orange) homology groups slightly increases when the cut-off for this category is lowered from 100% (200 genomes) to 1% (2) in steps of 1%. Unique/cloud (blue) start at 0.00 which represents a single genome. Using a 0.01 cut-off, groups are unique/cloud having 2 genomes or less. The threshold is further increased to 100% (200) in steps of 1%.
Pangenome structure
Iterations of random genome combinations according to the models proposed by Tettelin et al.* in 2005 are used to determine the contribution of new accessions with respect to the increase in core, accessory, and unique. Each iteration starts with three random genomes from which core, accessory and unique homology groups are identified. Subsequently, random genomes are added and group reclassified until the maximum number of genomes is reached. To simulate the overall pangenome-size increase and core-genome decrease, we suggest to use at least 10,000 iterations. Additional copies of a gene are ignored in the simulation.
Heaps’ law (a power law) can be fitted to the number of new genes observed when increasing the pangenome by one random genome. The formula for the power law model is \(\Delta n = k * N^{-a}\), where Δn is the newly discovered genes, N is the total number of genomes, and k and a are the fitting parameters. A pangenome can be considered open when a < 1 and closed if a > 1.
Pangenome size estimation is based on homology groups. This function
requires the sequences to be already clustered by
group. The same simulation can be performed
on k-mer sequences instead of homology groups with --kmer. As the number
of k-mers is significantly higher than the number of homology groups, the
runtime is much longer and the (default) number of loops is set to only 100.
Since this function is based on random genome combinations, the results may vary
slightly between runs. Please use the --seed option to set a seed for the
random number generator to make the results reproducible. By default, a random
seed is used.
- Parameters
<databaseDirectory>
Path to the pangenome database root directory.
- Options
--threads/-tNumber of parallel working threads. Default is the number of cores or 8, whichever is lower.
--include/-iOnly include a selection of genomes.
--exclude/-eExclude a selection of genomes.
--kmer/-kPangenome size estimation based on k-mer sequences (homology-groups is default).
--loopsNumber of loops (default is 10.000 for homology groups, 100 for k-mers or when using variant information).
--pavsUse PAV information for calculating the pangenome structure. Cannot be used with
--kmer.--seedSeed for the random number generator. Cannot be used with
--kmerwhen using more than 1 thread.- Example commands
$ pantools pangenome_structure tomato_DB
$ pantools pangenome_structure --exclude=1-3,5  tomato_DB
$ pantools pangenome_structure --loops=100 --kmer tomato_DB
$ pantools pangenome_structure --pavs --loops=100 tomato_DB

$ R script pangenome_growth.R
$ R script gains_losses_median_or_average.R
$ R script gains_losses_median_and_average.R
$ R script heaps_law.R
$ R script core_access_unique.R
- Output
Output files for homology-group based estimation are written to /database_directory/pangenome_size/gene/
pangenome_size.txt, various statistics on the number core, accessory, and unique homology groups for the different pangenome sizes.
gains_losses.txt, the average group gain and loss between different pangenome sizes. First the average number (core, accessory, and unique) groups for each pangenome size is calculated. The average gain and loss of groups is then found by subtracting the averages of a certain size to the averages of one genome larger (e.g. pangenome size of 5 is compared to 6).
gains_losses_last_genome.txt, the number of (core, accessory, and unique) groups that are gained or lost when including one of the genomes to a pangenome of the remaining genomes.
pangenome_growth.R, an R script to plot the number of core, accessory and unique groups for the different genome combinations. Second option is to only plot a core and accessory curve by including unique groups to the accessory.
gains_losses_median_and/or_average.R, R scripts to plot the average and median group gain and loss between pangenome sizes.
heaps_law.R, an R script to perform Heaps’ law.
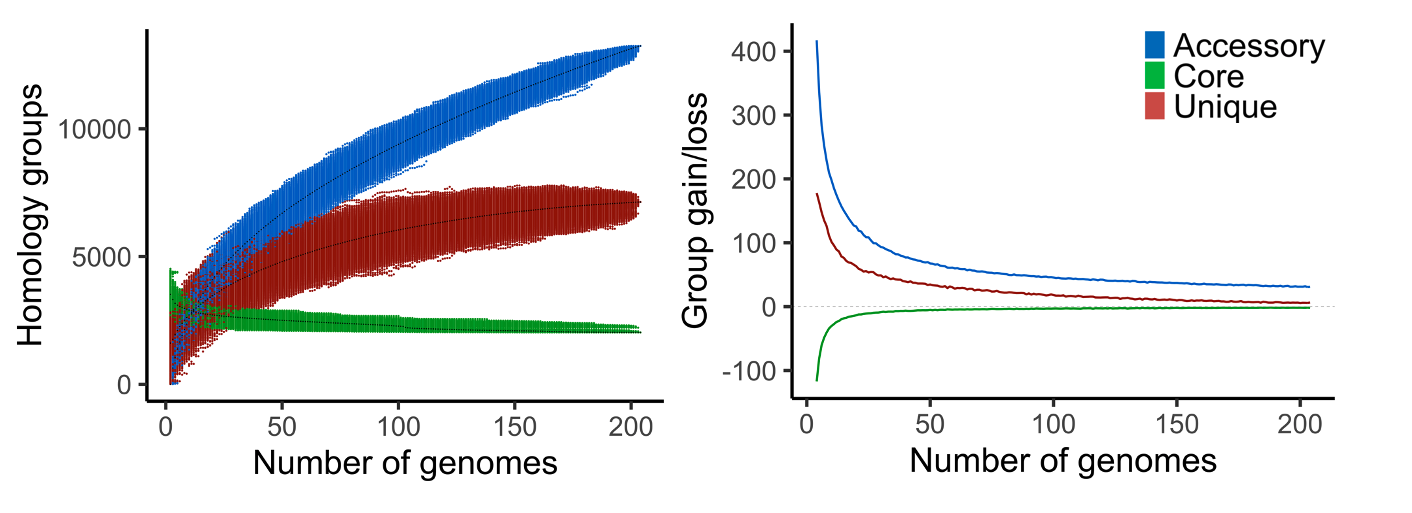
Fig. 15 Example output of pangenome_growth.R (left) and gains_losses_median_and_average.R (right) on a pangenome of 204 bacteria.
Output files for k-mer based estimation are written to /database_directory/pangenome_size/kmer/
pangenome_size_kmer.txt, statistics of the number of k-mers with different pangenome sizes.
core_access_unique.R, an R script to plot the number core, accessory, unique k-mers for the different genome combinations.
core_access.R, an R script to plot the number of core and accessory (including unique) k-mers for the different genome combinations.
- Relevant literature
K-mer classification
Calculate the number of core, accessory, unique, (and phenotype
specific) k-mer sequences. Because k-mer sequences of non-branching
paths of the DBG graph are collapsed into a single node, k-mers are
first uncompressed before they are counted. When --compressed
is included, sequences are not uncompressed and considered as a single
k-mer. Nucleotide nodes with a ‘degenerate’ label contain letters
other than the four non-ambiguous ones (A, T, C, G). and are ignored by
this function.
- Parameters
<databaseDirectory>
Path to the pangenome database root directory.
- Options
--include/-iOnly include a selection of genomes. This automatically lowers the threshold for core k-mers.
--exclude/-eExclude a selection of genomes. This automatically lowers the threshold for core k-mers.
--phenotype/-pA phenotype name, used to identify phenotype specific k-mers.
--compressedDo not uncompress collapsed non-branching k-mers for k-mer counting.
--core-thresholdThreshold (%) for (soft) core k-mers. Default is 100% of the genomes.
--unique-thresholdThreshold (%) for unique/cloud k-mers. Default is a single genome, not a percentage.
--phenotype-thresholdThreshold (%) for phenotype specific/shared k-mers. Default is 100% of genomes with phenotype.
--threads/-tNumber of parallel working threads. Default is the number of cores or 8, whichever is lower.
--sequencePerform the analysis on a sequence level in addition to genome level.
--phasingAnalyse phased genomes.
- Example commands
$ pantools kmer_classification tomato_DB
$ pantools kmer_classification --phenotype=resistant --exclude=2,3,4 tomato_DB
$ pantools kmer_classification --compressed --core-threshold=95 --unique-threshold=5 tomato_DB
- Output
Output files are written to /database_directory/kmer_classification/
kmer_classification_overview.txt, some general statistics and percentages about the core, accessory unique k-mers per genome.
kmer_occurrence.txt, the occurrence of k-mers per genome and total occurrence in the pangenome.
kmer_distance_tree.R, an R script to cluster genomes with four different k-mer distances to choose from. For more information, see The k-mers are ordered from high to low by the total number of genomes the k-mer is found.
unique_kmers.csv, the node identifiers of unique k-mers ordered by genome.
phenotype_specific_kmers.csv, the node identifiers of phenotype specific k-mers.
phenotype_shared_kmers.csv, the node identifiers of phenotype shared k-mers.
The following functions can only be used when any type of functional annotation is added to the database.
Functional classification
Similar to gene and k-mer classification, this function identifies core, accessory, unique functional annotations in the pangenome. Only the following functions are considered for this analysis: biosynthetic gene clusters from antiSMASH, GO, PFAM, InterPro, TIGRFAM.
- Parameters
<databaseDirectory>
Path to the pangenome database root directory.
- Options
--include/-iOnly include a selection of genomes. This automatically lowers the threshold for core genes.
--exclude/-eExclude a selection of genomes. This automatically lowers the threshold for core genes.
--annotations-file/-AA text file with the identifiers of annotations that should be used. The most recent annotation is selected for genomes without an identifier.
--phenotype/-pA phenotype name, used to find functions specific to a phenotype.
--core-thresholdThreshold (%) For (soft) core functions (default is 100%).
--unique-thresholdThreshold (%) For unique/cloud functions (default is a single genome, not a percentage).
- Example commands
$ pantools functional_classification tomato_DB
$ pantools functional_classification -p=flowering_time tomato_DB
- Output
Output files are written to /database_directory/function/functional_classification/
functional_annotation_overview, number of core, accessory, and unique functions. Holds the number of phenotype shared and specific functions when a phenotype is included.
core_functions.txt, functional annotations found in every genome of the pangenome.
accessory_functions.txt, functional annotations labeled as accessory.
unique_functions.txt, functional annotations unique to a single genome.
When a
--phenotypeis includedphenotype_shared_functions.txt, functional annotations shared by all phenotype members.
phenotype_specific_functions.txt, functional annotations specific to certain phenotypes.